Showing posts with label Advanced technical analysis. Show all posts

Monday, June 19, 2023

NIFTY: Path Ahead for Coming Weeks using Elliott Wave and Channel

 Nifty “closed” at lifetime high levels on 16th June 2023 at 18826. It just missed crossing above the 18887 which is previous high levels touched on 1st December 2022.

Let us look at the overall Elliott wave perspective to understand the maturity of trend and if more steam is left over coming days.

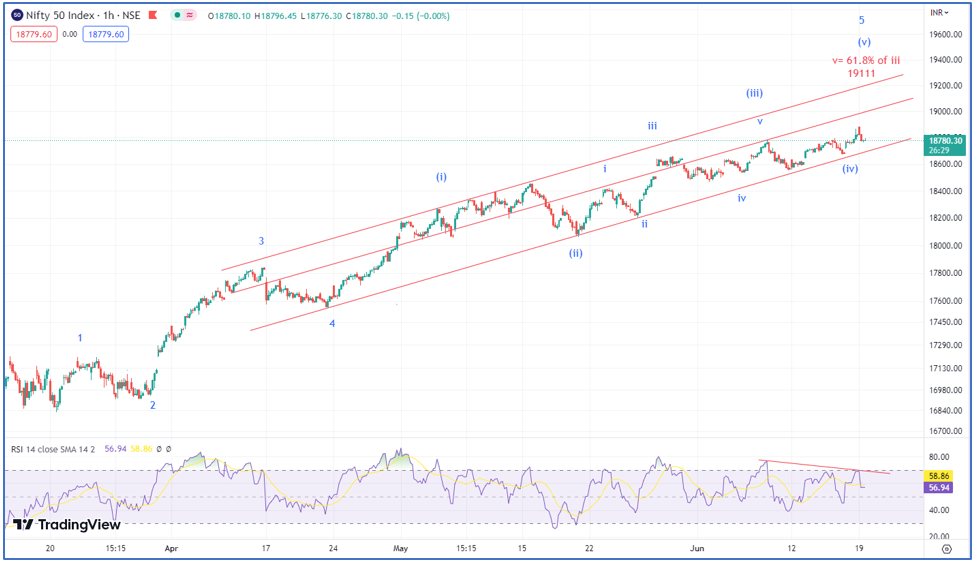
Nifty hourly chart – 

Elliott Wave analysis:

Nifty path ahead – As shown in Nifty hourly chart, rise from the lows of 16828 is in impulse pattern that consists of 5 waves. There is extension in wave 5. Prices are also moving in red channel and currently wave (v) of 5 ongoing. As per this Nifty can hit lifetime highs above 18887 levels and eventually move to the levels of 19111. This is where wave v is 61.8% of wave (iii).

Wave personality suggests that wave (v) is usually associated with slower momentum and we can see the same on the above chart where RSI is making lower highs with prices making higher highs.

It is prudent to avoid catching a top unless we see close below prior week’s low which is near 18530 over short term. For nearly 12 weeks there is not a single close below prior weekly low on index and so it is still buy on dips. Many are trying to catch a top here as the momentum is slower but do remember that prices can continue to rise with slower momentum unless price action confirms. 

Master of Cycles – Learn the science of Trading Time in simple step by step process. Hurst’s Time cycle technique combined with KST, Gann square of 9. This course is for everyone looking forward to increase their accuracy by timing the market and trade profitably using the scientific approach to trading. Online live event on 24th – 25th June 2023, Only a few seats left. 

Thursday, June 15, 2023

Nifty Neo wave, 55 Days Time Cycle with Momentum Indicator


Elliott wave and Neo wave are forecasting technical analysis method that helps to understand the maturity of trend. This when combined with Time cycles can help to time the trade accurately.

Below chart of Nifty is showing Time indicator – KST along with Neo wave counts and why we are matured stages of up move?

Nifty daily chart:

Nifty when broke above 17060 we turned super bullish as prices were completing wave (b) and starting wave (c) on upside. We published the research in our daily equity research report The Financial Wavesshort term update

Now the markets have rallied nearly 1800 points from there and the momentum is reducing.

KST indicator – this is a time indicator as it takes summation of various Rate of change and is plotted as single indicator. KST also known as Know Sure Thing is developed by Martin Pring. This along with Time cycle application provides much needed clarity to time the market.

Neo wave – The internal counts of wave (c) is suggesting that prices are moving up in form of Diametric pattern which is a 7 legged pattern. Currently prices are in wave f formation which can be sideways to little pressure on downside. Post its completion wave g on upside can resume. So the trend is matured but we might still be in buy on dips mode for another week or so.

55 Days Time cycle – We can see that prices tend to form low and reverses back up from the middle line which is 55 days days cycle. The low may not be a major low but it can also be a minor down move and upside reversal. The latest black middle line also acted as reversal day where wave b got completed and prices started moving higher in wave c. Next cycle low is going to be on 6th July 2023.

In a nutshell, Nifty can drift higher with lack of momentum. Short term correction is possible but one more leg on upside in form of wave g can start taking prices to Gann levels of 18838 or near lifetime highs. But combine this with short term charts and trade accordingly.

Thus by combining Neo wave, Time cycle and indicator like KST one can form prudent strategy for trading stocks or even futures and options. This technique can be applied on daily, hourly and even 15 minutes time frame for Intraday trading.

Master of CyclesLearn the science of Trading Time in simple step by step process. Hurst’s Time cycle technique combined with KST, Gann square of 9. This course is for everyone looking forward to increase their accuracy by timing the market and trade profitably using the scientific approach to trading. Online live event on 24th – 25th June 2023, Only a few seats left. 


Monday, June 12, 2023

Nifty 15 Minutes Time cycle – Trading Ichimoku Cloud

 Is it possible to Time the market for Trading?

Yes – Time cycle is scientific approach to identify the possible reversal and can help Options Traders to Time the market.

Price action techniques if combined with Time cycles one can trade exceptionally well with high accuracy.

Nifty 15 minutes chart: 43 period Time cycle

Nifty 43 period Time cycle on 15 minutes chart is plotted above. The vertical lines are the zone of Time cycle from where we can see short term upside reversals.

On most of the occasions prices have showed pullback or upside move after it has come within the zone of red and blue vertical lines. This lines are placed every 43 candles.

It means that after every 43 candles prices have tendency to move on upside. This if clubbed along with price action technique can provide complete trade setup.

Ichimoku Cloud – This is price focused indicator and provide complete insight into support, resistance, trend of the market. When prices move from below the cloud (highlighted green and red color) back above it we can see upside thrust form time cycle zones.

Currently prices are below the cloud and so from Time cycle zone we are seeing only minor pullback, but if prices reaches the time cycle area when it is above the cloud we get strong trend on upside.

In a nutshell, prices need to break back above the cloud resistance near 18640 and then when it approaches Time cycle vertical line it will provide classic opportunity to go long again. This concept of Time can be applied not only on 15 minutes chart but also on daily, weekly and monthly charts for Investment purpose.

Master of Cycles – Timing the market to very Day, Hour and Minute by combining this concept of Time trading along with KST indicator and Ichimoku Cloud. Online session on 24th – 25th June 2023 along with followup session. Limited seats only, Register now over here

Mentorship on Trading - Above chart simply shows how price action along with Time cycle and Neo wave can be combined. A Mentor can ensure that proper application of these methods is passed across so that it can form a powerful system to generate that parallel source of income. Be a part of Elite traders community we call as #TimeTraders. Know more here.

Monday, September 10, 2018

How to create a trade set-up for beaten down banking stocks?

Equity markets have been in frenzy since past few days. Sector specific action has continued. During such times it becomes difficult to find a trade set-up. We have been able the capture the swings in various stocks with the help of Elliott Wave and other basic techniques. Kotak Bank is one such stock wherein we captured the move from 1256 towards 1215 levels.

 Below is the research which we have published in our daily report “The Financial Waves STU”

Kotak Bank 60 mins chart: Anticipated as on 5th August 2018


Kotak Bank 60 mins chart: Happened as on 10th September 2018
 
 (Below is an extract of write-up taken form the research report)

Anticipated:
In the previous session Kotak bank traded in the red zone and made a low near 1251 levels. Post forming a lifetime high in July the stock has not shown any sign of positive reversal and break of important resistance levels are required for the bias to turn positive.      
As shown on 60 mins chart, prices are currently moving in the last leg of Diametric pattern, wave g which is expected to take the prices towards 1221 levels which is also the 50% retracement of the previous rise. Also, the EMA is acting as a resistance which keeps the bias bearish until we see the prices moving above the EMA.
In short, overall trend for Kotak Bank looks negative. Any pullback towards 1265 can be used as a shorting opportunity for a move towards 1220 levels.
Happened:Kotak bank moved precisely in line with our expectation and post showing a pullback till 1265 levels moved downwards to make  a low near 1215 levels.
Get access to the daily equity research report – The Financial Waves short term updates" which provide view on the Nifty, Bank Nifty and other stocks in our daily report - See now


Friday, June 29, 2018

How to become a trader? What are the steps to follow?

I am sure many who are new to trading would be confused on where to start as there are plethora of information and methods available. When I started my career I had the very same question but unfortunately no one to guide or advice on how to move forward.

So I ended up reading anything and everything I came across involving large number of techniques mentioned in various books. Slowly and steadily I realised there has to be a few methods that appeal to you most that you have to build up on.

My journey started learning the most basic methods of technical to the most advanced concepts of Elliott wave, Neo wave, Hurst’s Time cycles and Gann projections.

I know the pain of not knowing how to proceed and have worked hard without finding a mentor to suggest corrective path. It is then I decided to impart whatever I have learned in the simplistic way for anyone who wants to walk the similar path of becoming from novice to expert trader.


So here is one basic method that I found amazingly helpful in increasing the accuracy. Below is my latest webinar where I discussed a few methods in detail:


It does not matter if you are not aware about basic technical analysis. If you are attending my seminar on 21st – 22nd July 2018 in Mumbai on Elliott wave, Neo wave and Husrt’s Time cycles, I will ensure to share across enough materials for someone to be aware about what is technical analysis even before they attend the training. To Register Contact us here or Email us helpdesk@wavesstrategy.com

Cheers,
Ashish Kyal, CMT


P.S. – I hope the above is atleast providing some assistance in direction of systematic and scientific approach to trading

Wednesday, February 14, 2018

What is difference between Elliott wave and Neo wave? Application on Nifty charts!

Neo wave is an Advanced Elliott wave method with more number of rules and newer patterns to increase the overall objectivity.
Orthodox Elliott wave was originally discovered by R. N. Elliott in 1930s. His original work mentioned that stock market does not move randomly but in systematic fashion that follows Fibonacci numbers and natural laws. This systematic movement in prices are in form of waves. Normally there are 5 steps forward and 3 steps backward resulting into a net progression which is valid for stock market as well. The concept cannot be just applied but one needs to understand the basic premise and certain rules to apply it objectively.
Any price movement as per basic Elliott wave is classified into Impulsive and Corrective. There are various patterns within these broader heads. Impulsive waves need to follow three basic rules:
  1. Wave 2 cannot retrace complete of wave 1
  2. Wave 3 cannot be the shortest of the directional waves 1, 3 and 5
  3. Wave 4 cannot enter into territory of wave 1
The above 3 basic rules if followed then the price movement under consideration can be classified as a normal Impulse wave.
However, when the market structure is complex there is possibility that the movement can be counted in many different ways. This can result into subjectivity and the entire purpose of wave theory can be lost. To overcome this limitation Neo wave was developed that has more than 15 different rules to define a simple impulse pattern. Following are a few of them:
  1. Wave 2 cannot retrace more than 61.8% of wave 1
  2. Wave 3 cannot be the shortest of the directional waves 1,3 and 5
  3. Wave 4 cannot enter into territory of wave 2
  4. There has to be atleast one extended wave which is going to be 1.618% of non extended wave. If there is no extension then the pattern under consideration is corrective
  5. One of the directional waves should subdivide
  6. Corrective waves should consume more time than the preceding impulsive wave
  7. Touch point rule: Out of 6 points not more than 4 points should lie on the channel
  8. …etc
The above shows only a few set of rules for an impulse pattern as defined by Neo wave. There are newly developed patterns as well which were never a part of original Elliott wave. To name a few are:
–   Diametric Pattern
–   Neutral Triangle
–   Extracting Triangle
–   3rd Extended Terminal with 5th Failure
These new patterns are equally important to understand because majority of the movement seen in the world equity markets are taking the forms of these patterns that were never covered in original work of R. N. Elliott
We take a step ahead and combine this complex study of Neo wave to that of Time cycles. It is not always that both the studies will be in sync but when they are indeed suggesting the same outcome that is the time that the trade setup is of very high accuracy and it just leaves only one probable outcome. These are the times when one can go all in with prudent risk and money management strategies which have the potential to give the best of the returns in shortest amount of time.
Below part of research was shown 01st February 2018 daily research report when Nifty was in the toping zone that too on the Budget day!
Nifty 60 mins chart – Anticipated on 1st February 2018

Nifty 60 mins chart – Happened & Anticipated on 2nd February 2018

Happened as on 6th February 2018:
Nifty 60 mins chart:

The above charts are self-explanatory and simply show power of Neo wave.
Following was mentioned on Budget day before markets opened on 1st February 2018
“It is best to trade systematically with 10920 as very important support and 11170 as important resistance. As the fall of past two days is overlapping without any momentum we might see positivity or atleast a retest of 11120 levels.” BANG ON!
Happened: Nifty touched high of 11117 before reversing for the month
On 2nd February morning research we mentioned that – it seemed to be a populist Budget like everyone expected but introduction of Capital gains is going to result an impact which is not yet discounted maybe due to artificial support. Trade carefully as the swings can still be big over next few days! Move above 11120 is must to resume the positive trend else break below 10878 will be strongly bearish!
Happened: Low at 10878 was broken and everyone knows the serious selloff resulted into price moving towards 10276 levels in less than a week.
The above clearly shows how understanding Neo wave pattern helped us to catch a top when majority were busy buying exactly at the wrong levels and wrong time. The fall also happened precisely towards the level of 76.4% retracement of the rise which was shown on the daily research report.
References are taken from “The Financial Waves short term update” daily research report which covers Nifty, Bank Nifty and stocks on rotational basis and “The Financial Waves Monthly update” that shows medium to long term perspective on Nifty, INR Pairs, Global Markets, Gold, other commodities. For subscription options visit Pricing Page
Valentine day’s offer-  Subscribe to any of the research product today and get flat 20% off. For more details please get in touch on helpdesk@wavesstrategy.com or what’s app us at +91 9920422202
Attend the most Advanced Technical analysis training on Application of Neo wave and Time cycles with practical charts on different time frames for intraday to positional trading and investments. This training will focus on the above methods along with lot of other studies which can be combined together to produce very high conviction trade setups. Register NOW For more details Contact US or write to us at helpdesk@wavesstrategy.com or call us at +91 22 28831358 / +91 9920422202

Friday, January 13, 2017

Most Advanced Technical analysis Training on Elliott wave, Neo wave and Hurst's Time cycles- Identifying trading opportunities with various indicators

Elliott Wave, Neo Wave and Time Cycles are one of the most advanced concepts of technical analysis.

Equity markets have continued to move in complex patterns. 2016 was a year of consolidation as Nifty settled in December 2016 where it started the year. However, during this period there were plenty of opportunities as prices moved all the way from 6825 to the highs of 8970 and back towards 7900 in December 2016. So there were huge swings that one could have capitalized provided he or she had the right tools to understand the market movement.

Trust me trading involves combination of skills across Technical analysis, Risk Management, Money management and Mental strength - Psychology. I will be sharing across my personal experiences involving pitfalls a trader should be aware of and belief in the methods or techniques that helped me to be against the crowd at important turning junctures which was responsible to pay off for all the hard work and efforts.

Many believe that keeping it simple is the key to trading success but only if markets were moving in a strong Bull or Bear trend where buying on dips or selling on rallies is the brilliant strategy. 

However, when we are witnessing huge swings but hardly any progress in either direction on net basis learning advanced methods is utmost important. It is during such phases I built up my expertise on Elliott wave, Neo wave and later timing the trade with the help of Hurst’s Time cycles.

Time is the essence for everything. It is applicable not only to our day to day life but for freely traded markets as well. A good trade setup if not timed properly can still result into a serious loss. There are very few technical analysis studies that focus on Time since most of the techniques are driven by Price alone!

The course is designed to aim at the following aspects of trading:
1. Best Trade setups to enter the market
2. How to make the most of the position by timing the exit
3. Know when not to trade – A key to trading success
4. Applying multiple techniques along with Elliott wave for high conviction trade setups
5. Time cycles – A very important element to help reduce the number of probable scenarios to nearly one!
6. How to keep the profits intact after a winning streak…

Ashish Kyal, CMT will be conducting Most Advanced Technical Analysis Training – Neo wave and Time Cycles in Mumbai on 18th – 19th March 2017.

About Trainer:
Ashish carries vast experience of analyzing World Equity, Currency and Commodity markets using techniques like Elliott WavesNeo wave,Time Cycles, and momentum tools like RSI, MACD, Moving averages, customized indicators. He is a frequent speaker on business channels like ET Now, Zee Business, CNBC TV18, Bloomberg TV.
Ashish also speaks at financial seminars like Market Technicians Association (MTA - USA), Association of Technical Market Analysts (ATMA), National Institute of Bank Management (NIBM), Sydenham Management college. He is on the selection panel of GDPI for premiere B- Schools and invited by Somaiya Institute of Management Studies and Research to speak on Entrepreneurship. He has also been invited as a guest speaker at National Stock Exchange of India (NSE) for the Post Graduate Certificate Program in Financial Economics.

Training Details:
This training would cover Advanced Technical Analysis Concepts – Elliott Wave, Neo Wave and Time Cycles. Practical application of these advanced tools along with charts on Equity, Commodity, Forex and Global Markets.

Contents:
1. Overview of Elliott Wave
2. Neo Wave – Difference between Elliott wave and Neo wave
3. Methods to plot Neo waves on charts for clear wave identification
4. Combining this with Bar techniques, Indicators, Trader psychology
3. Two stage confirmations for capturing key reversals
4. 5. Newly discovered patterns – Diametric, Extracting Triangle, Neutral Triangle
7. Cycle Analysis: Time the market with accuracy using Time cycles
8. Trade setups, Application of the concepts on charts
9. Momentum Stock selection for Intraday trades with exit strategies

SCOPE
The training is ideal for those who want to analyze and understand Equity / Commodity / Forex markets in detail. Traders or investors who want to learn on how to build their investment portfolios or do trading for living. The course is designed for anyone and everyone keen to learn systematic way of trading using scientific approach. The only pre-requisite is passion for learning objective method of trading.

WHO SHOULD ATTEND?
§ Members of Equity, Commodity, Currency exchanges
§ Brokers / Traders / Dealers
§ Research analysts in Equity, Commodity and Currency markets
§ Students who aspire to pursue career in Financial Markets
§ Treasury dealers of Banks and Corporate

Where and when is the course?
The training is at Hotel Grand Sarovar Premiere, Goregoan, Mumbai. This belongs to 5 star category having chain of international hotels and the fees are including Tea / Coffee and Lunch.

Dates: 18th and 19th March 2017

Training Duration: 16 hours (8 hours per day)

Registration Fee:
The charges for the Training are Rs. 23000 + 15% Service tax. Register before 31st January 2017 to avail Early Bird Offer – Discounted price along with access to Free research for limited time, Elliott wave crash course videos before the training itself. Confirm your seat today!

If registered after 31st January 2017 charges would be Rs. 26000 +15% Service tax

Limited seats, Registration is on first come first basis.

Refer a friend and get 10% discount

After the course :
1. One Month of free Nifty Neo wave research report to understand the practical application on realtime basis
2. Instant interaction on Discussion Forum at www.wavesstrategy.com
3. All participants will be entitled for 20% Discount on any of our research products after the course for 1 month subscription
4. Training Certificate on Elliott wave, Neo wave and Time cycles

How to Enroll?
To register for the training using either Credit Card or Netbanking visit http://www.wavesstrategy.com/Payment.aspx  and mention Product as “Neo wave Training” and period as “1”

For any other details call us on +91 22 28831358 / +91 9920422202 or write to us at helpdesk@wavesstrategy.com      

Testimonials    
  • I was the last candidate getting into Mr. Ashish Kyal webinar and I was very lucky to have boarded to me as his classes were how my first teacher taught me a b c d he was clear precise and ensured that even a layman like me understood every minute thing about being technical and about the wave patterns. He covered what could be termed at school a dry subject with so much of passion and created an auto instinct in students like me to be glued to what was an absolute transformation of how we look at charts. In fact I have become a fan of my guru and will be part of his journey here on ... Continue your good work. You are very genuine in what you are doing in this world of fake people My name is Subramanian Mahalingam My qualification is I am BCOM, ACA Grad, CWA and Masters in Oracle Financials I am CFO of an Infra company and group with topline of 1000 cr.
       - Subramanian Mahalingam, Telengana

  • The simplification of complex subject of "Elliot Waves" and combination of Elliot Waves with Classical Technical Tools are not only Awesome, but Unique too. I've thoroughly enjoyed Mr. Kyal's Seminar at Sarovar Premier Hotel, Bombay during 13th & 14th October, 2013 because of his Flawless, Plain (Jargon free) and Lucid Language. Best of all I liked his virtue to teach what he really performs in his real professional life.And last, but not least, Mr. Kyal's Seminar was the Best of All Seminars I've ever attended
       - Kiran Banjara, KB Investment Avenues, Ahmadabad-GJ 

  • Myself Sameer. Just want to share my feedback. From last 7 years, I am doing full-time trading in F&O segment (Nifty & Bank Nifty) using my technical study and Elliot wave counting. I attended 2 days Neo Wave seminar on 1st March at Goregaon. The session and teaching by Mr. Ashish Kyal was excellent. The topics covered in session e.g. new Neo wave patterns, new Elliott rules, 2 stage confirmation and Time Cycles were very useful. Today I applied these techniques on Nifty and Bank Nifty (Daily & 60 Min charts) and its working perfectly fine. I am very much satisfied with the course. Just want to say Thank You for sharing such valuable knowledge. I have also subscribed for your daily mail service on Nifty EOD and Elliott view. From last 3 months, I am reading these mails daily. I always verify my own analysis with your mails, before taking any entry in market. The accuracy and success ratio of your mails (analysis) is more than 98%, which is excellent. Thanks again.

      - Sameer Dharaskar,Mumbai
Thursday, March 31, 2016

Tatasteel: Is multi-month low in place for commodity stocks?

Commodity and Energy stocks have been one of the worst performers post 2008 crisis. Tatasteel also had been a strong underperformer and few months back it came close to the low formed in 2008. But is this underperformance near completion?

A trader or investor should be open to the fact that news do not drive the prices higher of lower. But people tend to find logical news fitting the puzzle post the move has happened.

Tata Steel also showed strong recovery after flirting around 200 mark as the trend was due to reverse. Look at the below chart:

Tata Steel daily chart:

Tata Steel,Commodity Stocks,Elliott Wave, Training on advanced Elliott Wave

Wave analysis: The below research is picked up from “The Financial Waves short term update”

There was positive news for the steel sector today - India has extended safeguard import taxes on some steel products until March 2018, a government order said on Wednesday, as it looks to curb imports of cheap Chinese steel and shield domestic mills.

It seems logical to justify the up move in metal stock after the positive news. However, Metal stocks like Tata steel has been already in uptrend for many weeks even before this news came out.

The daily chart shows that prices have competed Triple standard correction pattern at the low of 210 level in the month of February 2016 and post that we are witnessing impulsive rise in this stock which is the bullish sign. It is very rare to see impulsive rise in Metal stock as few months back this sector was the most underperforming one. This increases the odd that medium term trend may be reversing on upside. We will obtain medium term positive confirmation in Tata Steel once prices move above …… level. For now as long as prices sustains above the important support of ………. level trend will be positive.

By combining Advanced Technical Analysis on Equity stocks it is possible to understand and trade in that direction with key risk reward ratio.

“The Financial Waves short term update” is a daily Equity research report published everyday morning before equity market opens that shows detailed Elliott wave counts and patterns on Nifty and stocks that can assist a trader in making trading decisions. Subscribe directly by visiting Pricing Page and selecting the product.


Wednesday, August 12, 2015

How Bank Nifty is providing leading signals for turn in Nifty? Intra-market divergences!

Nifty has moved sharply lower from the highs of 8622 to the recent low of 8381. This move has happened in less than 3 days.

At times it becomes important to look at the other sub-indices apart from Nifty to understand if they are providing clues about reversal in overall market direction.

The below chart is shown in the morning research report The Financial Waves short term update along with detailed Elliott wave counts on daily and hourly charts.


Nifty and Bank Nifty hourly chart with divergences:


Wave analysis:

In previous update we mentioned that, the down move from 8622 increases the odd that Expanding Triangle pattern in wave e may have completed. To confirm the same now move below 8445 is required.”

In the last session post opening near 8550 levels, Nifty quickly entered in the red territory. Throughout the day prices continued the down move and broke the level of 8445 which was the spike low made on RBI meeting day on 4th August 2015.

From time price reversal perspective, the up move from 8320 to 8622 has taken 8 days and yesterday was the first day where prices gave negative close below the prior bar’s low. So now move below ……….. is required in next ……….. days which will confirm that medium term down move has started with Price Time reversal confirmation.

Nifty and Bank Nifty divergences: Bank Nifty is an important index that is actually leading the fall. Even the bigger top made in March 2015, Bank Nifty formed lower highs when Nifty touched new high at 9119. These divergences are visible not only on the daily time frame but also on smaller degree charts shown above. We can clearly see that Bank Nifty has been constantly providing important negative divergences when Nifty breaks above previous pivot high but Bank Nifty failed to do so even this time.

The above chart also shows one positive divergence when Nifty broke the pivot low but Bank Nifty managed to form higher lows.

These are important indications but have to be combined along with other techniques like Elliott wave and Time cycle. Nifty has now broken important support levels and that too in faster time so far…. Most of the technical indicators are again aligned together after many weeks of sideways action.


To know more on the short to medium term direction of Nifty along with stocks and why we think a trending move is due to emerge using different independent techniques and combining with Time cycles, subscribe to the “The Financial Waves short term update”. For subscription options visit the Pricing Page or Contact US for more details.