Wednesday, May 31, 2023

VOLTAMP: Price Action with Powerful Indicators for Strong Returns

 VOLTAMP: Price Action with Powerful Indicators for Strong Returns


In the current market environment, there are stocks specific actions that can be witnessed. We can clearly see below the chart how bullish momentum can be captured.

Combination of trend indicator and price pattern is an amazing technique applied on a chart to understand why there was a rise and is this rise sustainable.

We published VOLTAMP analysis in "The Financial Waves Short Term Update" on 29th May which our subscribers received pre-market every day. Check out below the detailed research report that we published.

VOLTAMP Weekly chart Anticipated as on 29th May 2023

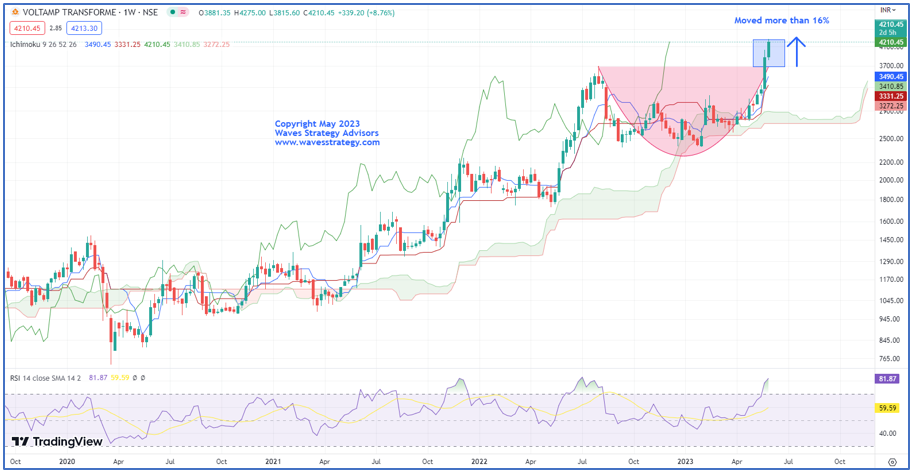
VOLTAMP Weekly chart Happened as on 31St May 2023

Wave analysis as on 29th May 2023

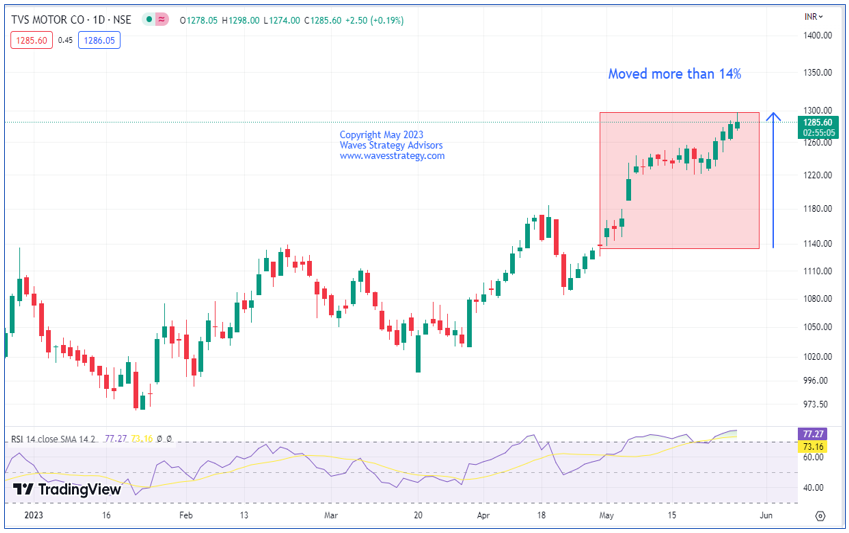
VOLTAMP has been moving higher recently and intact in strong uptrend. In the previous session it closed with a massive gain of 14.60%.

On the weekly chart, in the previous session prices formed a bullish candle. Price has close above 3692 level which confirm breakout of the rounding bottom pattern. Price is trading above the ichimoku cloud which indicate that the short-term bias is bullish. Closest support is placed at 3680.

In short, trend for this stock is positive. Use dips towards 3800-3840 as a buying opportunity for a move towards 4200-4250 levels as long as 3680 holds on the downside.

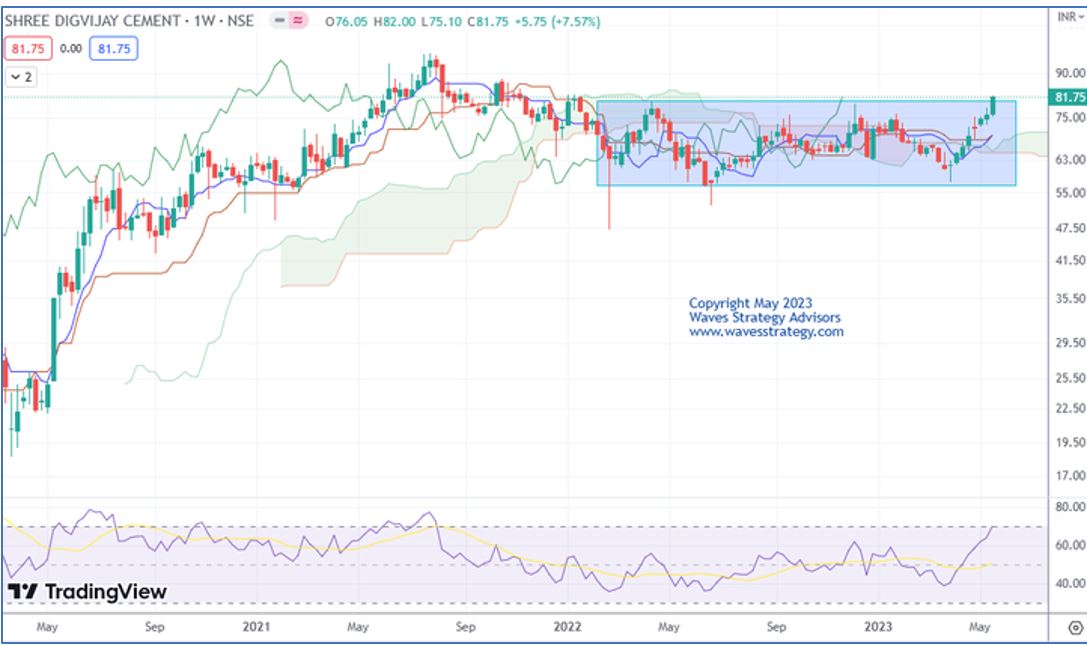
Happened: The stock moved as we expected. VOLTAMP have given a breakout of rounding bottom with huge volume which was a bullish sign. Within just 2 trading sessions, the stock made a high of 4275 levels which is more than 16% from the given levels. In such a volatile market, the stock is holding well at higher levels.

3 Months of Mentorship on Timing the Market – Above chart simply shows how price action along with Time cycle and Neo wave can be combined. A Mentor can ensure that proper application of these methods is passed across so that it can form a powerful system to generate that parallel source of income. Be a part of Elite traders community we call as #TimeTraders. 

Friday, May 26, 2023

TVS Motor: How to Identify Multibagger Stocks!

TVS Motor: How to Identify Multibagger Stocks!

By application of Elliott Wave, we can identify potential Multibagger stocks that can be added in portfolio. TVS motors was identified in the last month.

We publish TVS Motors in April 2023 and predicted a possibility of Multibagger returns. This stock has managed to outperform giving almost 14% returns in less than 30 days and made the high of 1298.

Below is the chart showing detailed analysis published in our research report- The Financial Waves Multibagger update.

TVS MOTORS (Anticipated on 28 April 2023)

Happened TVS Motor Daily Chart:

(Following research is taken from Multibagger report published on 28th April 2023)

Multi-bagger stock recommendation: TVS MOTOR

Buy Price – Buy at CMP 1135 and more on dips towards 965

Time Horizon – 2 to 3 years

Investment – 5% of capital

Target price – ??

Stop loss - ??

As shown in Weekly chart, since 2013 this stock is intact in big upward moving red channel. Within this channel we have seen different phases in prices such as bull phase and bear phase. Prices started moving in an impulsive manner. Wherein, wave 1 completed near 770 levels and then primary wave 2 started moving on the downside and completed in form of corrective pattern near 490 levels. Wave 2 took 4 years to get complete and then primary wave 3 is unfolding on the upside which is considered as a most impulsive one.

On the weekly chart, 150 period Exponential Moving Average is acting as a brilliant support line and it has provided support at regular intervals. This suggest that one should be in the direction of the ongoing trend as far as this line is protected. As per this, nearest support can be placed near 770 levels. Also, MACD is showing positive crossover which is acting as a double confirmation.

Happened as on 26th May 2023: - Price has moved up really well and today made a high of 1298 levels. The up move has been strong and we expect prices to achieve its target of …. levels in coming months. The stock is giving a return of more than 14% till the date.

The above analysis clearly shows how one can identify the stocks from positional investment perspective just with the help of Elliott wave, time cycles and other advanced indicators.

3 Months of Mentorship on Timing the Market – Above chart simply shows how price action along with Time cycle and Neo wave can be combined. A Mentor can ensure that proper application of these methods is passed across so that it can form a powerful system to generate that parallel source of income. Be a part of Elite traders community we call as #TimeTraders.

Wednesday, May 24, 2023

How to catch Momentum using Ichimoku cloud and price pattern

It is possible to capture good moves in stocks using price patterns along with simple indicators like ichimoku cloud. See how we identified such move in SHREDIGCEM.

Ichimoku cloud - The Ichimoku Cloud is a technical tool that indicate the support and resistance, identifies trend direction, gauges momentum and provides trading signals

The Following research is picked up from our daily Equity Research Report which our subscribers receive pre-market every day.

SHREDIGCEM Daily chart as on 22nd May 2023


SHREDIGCEM 60 mins chart as on 22nd May 2023

Wave analysis as published on 22nd May 2023

SHREDIGCEM has been moving higher recently and intact in strong uptrend. In the previous session it closed with a massive gain of 5.14%.

On the weekly chart, in the previous session prices formed a bullish candle. Price has been moving in a rectangular range over the last few days indicating accumulation in the stock. In the previous session prices manages to close above this trading range which has resulted in a bullish breakout of the rectangular pattern. Price is trading above the ichimoku cloud which indicate that the short-term bias is bullish.

As shown on the hourly chart, 70-day period Exponential Moving Average is acting as a brilliant support line and it has provided support at regular intervals. This suggest that one should be in the direction of the ongoing trend as far as this line is protected. Closest support is placed at 77.

In short, trend for this stock is positive. Use dips towards 80-81 as a buying opportunity for a move towards 89-90 levels as long as 77 holds on the downside.

Happened

As we expected stock after a dip witnessed a good rally of more than 5% in just 2 trading sessions. Stock made high of 86.50 and it has potential to achieved our target of 89-90 levels in coming sessions.

If we combine simple price action with price patterns then it together works like magic!!

3 Months of Mentorship on Timing the Market – Above chart simply shows how price action along with Time cycle and Neo wave can be combined. A Mentor can ensure that proper application of these methods is passed across so that it can form a powerful system to generate that parallel source of income.

Tuesday, May 23, 2023

Bank Nifty Path Ahead using ADX and Ichimoku Cloud

Banknifty has been moving precisely as per neo wave count. Checkout this example of how we applied ADX and Ichimoku cloud with Price Action to identify the wave counts and predict the price movement.

Following research is picked up from daily equity research report – The Financial Waves short term update

Bank Nifty Daily chart

Bank Nifty 60 mins chart

Wave analysis:

In the previous session, on the daily chart prices formed neutral candle. We can see that Index is consolidating in a range of 43500-44150. Any breakout of the range is needed to understand a bigger picture. ADX is trading at 21 suggesting lack of trending move and giving us hints of range bound action.

On the hourly chart, we have applied Ichimoku cloud. Wherein we can see that prices have just given a close above the cloud which is a positive sign. However, confirmation is still pending for which we need follow up action.  Along with this, MACD is showing positive crossover but further price action is required to confirm the same. Overall indicators are giving us hints of possible up move. Any move above 44150 can confirm completion of wave (b) on the downside and then the up move will be in form wave (c).

In short, Bank Nifty is trading in between a range of 43500-44150. A break above 44150 can lift the price higher towards 44500. Whereas any move below 43500 can drag price lower towards 43150.

3 Months of Mentorship on Timing the Market – Above chart simply shows how price action along with Time cycle and Neo wave can be combined. A Mentor can ensure that proper application of these methods is passed across so that it can form a powerful system to generate that parallel source of income. Be a part of Elite traders community we call as #TimeTraders.

Monday, May 22, 2023

Nifty Using Ichimoku cloud, MACD and Neo Wave Pattern

 Elliott wave and Neo wave are powerful technical analysis methods that can help traders with the complete setup right from Intraday to positional trades.

Below shows Nifty Neo wave count along with Ichimoku Cloud and MACD. This research is picked up from the daily Equity research report. “The Financial Waves short term updatewhich was published today before market opens

Nifty Daily chart

Nifty 60 mins chart

In the previous session, after opening with a minor gap up, prices could not sustain higher and sharp fall was witnessed which led prices to make low of 18060.40.

On the daily chart, The Nifty50 has snapped a three-day losing streak and closed on a positive note. Nifty managed to close above 18200 mark and formed a hammer type candle on the daily charts. Price has bounced back from the major support of 18060 and since then short covering was seen which led prices to close above 18200 mark near day’s high. Prices have bounced back on the upside by taking support of the base line. 

On an hourly chart, prices have moved up precisely by taking support of the channel which is a positive sign. Simple channelling techniques works well! Also, MACD has shown a positive crossover giving us hints of further possible up move. We need decisive break above 18300 for fresh buying to emerge.

As per wave perspective, prices are moving in Diametric pattern and as per neo wave prices completed wave (c) at the top and now wave (d) is moving on the downside. Any breach above 18300 can confirm the completion of (d) on the downside and then the rise will be in the form of wave (e).

In short, Nifty has snapped a three-day losing streak and closed on a positive note. For now, any breach below 18060 can drag the price lower till 17960. Whereas any breach above 18300 is needed for the fresh buying to emerge which can take prices higher 18400.

3 Months of Mentorship on Timing the Market – Above chart simply shows how price action along with Time cycle and Neo wave can be combined. A Mentor can ensure that proper application of these methods is passed across so that it can form a powerful system to generate that parallel source of income. Be a part of Elite traders community we call as #TimeTraders. 

Thursday, May 11, 2023

Bank Nifty Target using Neo wave and Time cycle

 Bank Nifty Target using Neo wave and Time cycle


Time cycle and Elliott wave works like a magic! If we combine it with simple price indicators then one can form a powerful trade setup with high accuracy. You can also do that especially if you know how apply it on various scripts.

We had used various advance techniques to catch a current up move in our last month The Financial Waves Monthly Update” research report. Check out the research we had published on 21st April itself –

Figure 7 Bank Nifty Monthly chart

Figure 8 Bank Nifty Weekly Chart

Figure 9 Bank Nifty Daily chart

Wave analysis as on 21st April 2023

In the recent MPC meeting announcement, RBI paused the repo rate hike by keeping it at 6.5%. This is the first time since May 2022 that central bank has not changed or revised interest rates. The RBI has raised interest rates by 250 basis points since May 2022.

This has definitely offered some relief to investors and unlike Nifty, Bank nifty also witnessed a good rise. Since the start of April, Banknifty moved more than 5% and witnessed a good rally within first 15 days only.

Channel and ichimoku cloud: On monthly chart, we have applied ichimoku cloud. We can see that Since October 2020 prices are trading above the cloud and every time prices have moved up by taking support of the base line. Along with this, index is following multiyear channel since 2010. KST has turned above the signal line suggesting positive crossover.

Bollinger bands: We had shown Bollinger bands on weekly chart. Last week index finally gave a weekly close above the mid bands which a positive sign. As prices are moving towards upper band which suggests that one should be in the direction of current uptrend as long as prices sustains above mid band. As per this, nearest support can be placed at 41500. Any move below 41500 can drag the price lower towards 40800 levels which is a crucial support. Any move below 40800 will indicate a pause in an uptrend.

Neo wave perspective: On the weekly chart, we can see that primary wave (b) has completed its course near 32290 in June 2022. After which wave (c) is moving on the upside which is subdividing in nature and moving in classic impulse manner. Currently intermediate wave 5 is moving on the upside.

In a nutshell, after a sharp rally now Index is consolidating which can be seen as a time wise correction. For now, any move above 42650 with follow up buying is needed for further bullish momentum to continue. Whereas, any breach below 41500 will indicate deeper correction towards 40800 levels. However, any move below 40800 will indicate that the short-term top has been made and then more correction cane be seen. 

Happened

Bank Nifty daily chart as on 11th may 2023

As we predicted in the last month, Banknifty has shown a good rise after giving a break above 42650. Recently prices made high of 43774 which is more than 4.5% move within short span of time. For now, one should avoid catching tops and can use buy on dips method to ride the trend by keeping a stop loss of 43250 level.

3 Months of Mentorship on Timing the Market – Above chart simply shows how price action along with Time cycle and Neo wave can be combined. A Mentor can ensure that proper application of these methods is passed across so that it can form a powerful system to generate that parallel source of income. Be a part of Elite traders community we call as #TimeTraders.

Wednesday, May 10, 2023

Tata Motors, Reliance, Bank Nifty, Neo wave – Cannot be More Accurate!

 Tata Motors, Reliance, Bank Nifty, Neo wave – Cannot be More Accurate!


Elliott wave along with Technical analysis with simple patterns like Diametric can give the much-needed edge for Trading.

Below are the various charts shown on Index as well as stocks which we derive in our recent session of MOW with 100s of participants.

Tata Motors 15 Mins anticipated in MOW session (which was conducted on 6th and 7th May)

Tata Motors Happened as on 10th May 2023

Reliance Industries 60 Mins anticipated in MOW session (which was conducted on 6th and 7th May)

Reliance Industries Happened as on 10th May 2023


Nifty Bank 60 Mins anticipated in MOW session (which was conducted on 6th and 7th May)

Nifty Bank Happened as on 10th May 2023

Above charts are picked up from different time frame and each of the forecasts has worked out extremely well.

The First Chart is of Tata motors in which we have successfully captured up move precisely using simple Elliott wave and stock made high of 514.80 which is more than 5.8% move.

The Second chart is of Reliance Industries in which we capture move of more than 2% using simple Impulse pattern.

The Third chart is of Bank Nifty where prices have followed a classic Diametric pattern. In which we expected wave g to complete on the upside. Post completion of wave g we saw a fall which can be wave x or a fresh down leg.

In nutshell, it is possible to derive trade setup in Index as well as on stocks using patterns, Elliott wave and Neo wave which can be seen above which is enough proof to show that these techniques work! When majority are guessing the direction, we were able to capture good moves. 

3 Months of Mentorship on Timing the Market – Above chart simply shows how price action along with Time cycle and Neo wave can be combined. A Mentor can ensure that proper application of these methods is passed across so that it can form a powerful system to generate that parallel source of income. Be a part of Elite traders community we call as #TimeTraders. 

Monday, May 8, 2023

IRCON: Massive Move by Combining Rounding Bottom with MACD

 IRCON: Massive Move by Combining Rounding Bottom with MACD


It is possible to capture massive moves in stocks using price patterns along with simple indicators like MACD (Moving Average Convergence Divergence). Check out how we selected IRCON which has rallied more than 29%

We published the following research on IRCON pre-market on 26th April 2023 in "The Financial Waves Short Term Update” which our subscribers receive pre-market every day.

IRCON Weekly chart (As on 26th April 2023)

IRCON Weekly chart (Happened as on 8th May 2023)

Wave analysis (As on 26th April 2023):

IRCON has been moving higher recently and intact in strong uptrend. In the previous session it closed with a gain of 3.10%.

On the weekly chart, in the previous session prices formed a bearish candle. A weekly close above 66.80 will confirm breakout of rounding bottom pattern. MACD is above 0 and MACD line crossed above the MACD signal line which indicates that bullish momentum has increased in this stock and may continue in the coming session.

In short, trend for this stock is positive. Use dips towards 68-69 as a buying opportunity for a move towards 76-77 levels as long as 66 holds on the downside.

Happened

The stock moved as we expected. IRCON have given breakout of Rounding Bottom with huge volume which was a bullish sign. After a dip, prices showed a sharp rise and achieved our target and moved way above it and made a life time high near 89.5 levels which is more than 29% in 5 days of span.

Winner of CNBC Awaaz show Khiladi No.1 for consecutive 3rd time:


3 Months of Mentorship on Timing the Market – Learn the science of Trading with complete handholding, lifelong association, clearly defined methods to enter, exit and booking profits in upcoming Mentorship program. This will life transformation journey with exclusive webinars even post 3 months. Step by step approach to simple and powerful trade setups. No minimum capital required, no software required, No prior knowledge.

Thursday, May 4, 2023

NIFTY: POWER OF ELLIOTT WAVES

 NIFTY: POWER OF ELLIOTT WAVES


Elliott wave along with simple price indicator helps to form powerful setups with a good accuracy.

Below is the various chart shown from a webinar conducted live with 1000s of participants.

NIFTY 15 MIN CHART (ANTICIPATED ON 3rd MAY)

NIFTY (HAPPENED as on 4th May)

Nifty has been moving precisely as per the Elliott wave and the above chart shows the same. As we can see, minor wave iv has completed near 18050 levels, and prices have reversed precisely from there. Currently, minor wave v is in progress.

One should combine Elliott wave along with simple price indicators which works like magic! When the majority were guessing direction, we used these techniques and were able to capture the up-move by adopting a scientific approach towards trading with the use of simple Elliott wave.

Master of Waves – Learn the science of Options Trading using Elliott wave, Neo wave and Hurst’s Time cycles along with Volume profile, KST indicator and Ichimoku Cloud. Become Market Wizard (BMW) is comprised of two modules – Options Trading using Technical Analysis (Online recordings) and Master of Waves – Live on 6th & 7th May 2023. Last 2 Days left, Limited seats only.

Wednesday, May 3, 2023

Canara bank: Combining Diametric Pattern with Ichimoku cloud

Elliott wave helps us to catch big moves and if we combine it with simple price action then it is possible to form powerful trade setups.

We published the following article on Canara Bank pre-market on 26th April 2023 in "The Financial Waves Short Term Update" which our subscribers receive pre-market every day.

Canara Bank Daily chart as on 26th April 2023 (Anticipated)

Canara Bank Daily chart as on 26th April 2023 (Happened)

Canara Bank Daily chart as on 3rd May 2023 (Happened)

WAVE ANALYSIS:

In the previous session, Canara bank opened on a flat note and during the day showed a good buying. At the end of the day prices closed with a decent gain of 1.57%.

On the daily chart, we have used Exponential moving average of 20 and 40 period. As we can see that EMA positive crossover has happened which is a positive signal. Along with this, price action is must to confirm the same. Also, prices are currently trading near its previous swing high which was near 314. Let’s see if we get a breakout or reversal back from it.  As per wave perspective, c looks to be completed on the downside. However, we need a follow up action to confirm the same. 

On the hourly chart, we have used Ichimoku cloud to understand overall price direction. As we can see that Prices are moving up by taking support of the base line (red). This suggests that any dip towards the base line i.e. towards 301 can be used as a buying opportunity. Prices are following a classic Diametric pattern, Wherein, last leg of the pattern is unfolding on the upside in form of wave g.

In short, Canara Bank looks sideways to positive. Use dips as a buying opportunity for a move towards 314 as long 298 holds on the downside.

Happened:

The wave counts have helped us to predict this move well in advance. After we published the report on 26th April 2023, the price kept moving higher and hit our target and recently made a high of 321.55.

Master of Waves – Learn the science of Options Trading using Elliott wave, Neo wave and Hurst’s Time cycles along with Volume profile, KST indicator and Ichimoku Cloud. Become Market Wizard (BMW) is comprised of two modules – Options Trading using Technical Analysis (Online recordings) and Master of Waves – Live on 6th & 7th May 2023. Last 3 Days are left, Limited seats only.

Monday, May 1, 2023

Nifty, Bank Nifty, Bajaj Finance – How Elliott Wave can help Trading Profitably?

 Nifty, Bank Nifty, Bajaj Finance – How Elliott Wave can help Trading Profitably?


Nifty, Bank Nifty and stocks like Bajaj Finance are moving in predictable patterns of Elliott wave with big player’s activity that can be seen as per Volume profile.

Many charts shown below are taken from exclusive webinar conducted to spread awareness about this scientific approach to trading. It reflects how one can trade using Elliott wave – GPS of the market.

Nifty Futures hourly chart with Volume profile – Anticipated

Happened:

Nifty moved precisely as per the path shown on Volume profile. Prices reversed from 17900 levels on downside and then moved sharply higher.

Bank Nifty hourly chart as per GPS – Elliott wave path

Happened:

Bank Nifty has moved precisely as per Elliott wave pattern. The above path was shown to 1000s of participants during live exclusive webinar and what we expect Bank Nifty to do.

Anticipated on 23rd April and Bank Nifty moved precisely as per the path shown. Showed sharp move on upside despite of majority of traders were not ready for explosive move on Bank Nifty. This shows power of Elliott wave Impulse pattern.

Nifty 5 minutes chart – Elliott wave (Anticipated on 23rd April 2023)

Happened as on 28th April 2023:

Elliott wave applied on 5 minutes chart of Nifty where the breakout was predicted on 23rd April 2023. Post completion of wave c in form of Ending Diagonal pattern it was expected that move above 17660 will start the next leg up in form of bigger wave 3.

Happened – Prices moved precisely as expected, completed wave c and moved sharply up crossing even above 18k levels. This move was perfectly in sync with Elliott wave.

Bajaj Finance Volume profile – Anticipated on 23rd April 2023

Bajaj Finance Happened on 28th April 2023:

Bajaj Finance charts above show how prices moved from Volume profile area. This technique of trading had been discussed in detail in Options Trading Using Technical Analysis (OTTA).

Happened: Bajaj Finance declared the results and the stock started gaining upside momentum but even before the move happened we were able to predict this by looking at volume profile.

Above charts gives enough proof that it works and these charts were shown before the move happened in live exclusive webinar with 1000s of participants. Trust me, It WORKS!

Master of Waves – Learn the science of Options Trading using Elliott wave, Neo wave and Hurst’s Time cycles along with Volume profile, KST indicator and Ichimoku Cloud. Become Market Wizard (BMW) is comprised of two modules – Options Trading using Technical Analysis (Online recordings) and Master of Waves – Live on 6th & 7th May 2023. Learn to Trade like a pro, Limited seats only.