Showing posts with label Impulse Pattern. Show all posts

Monday, June 19, 2023

NIFTY: Path Ahead for Coming Weeks using Elliott Wave and Channel

 Nifty “closed” at lifetime high levels on 16th June 2023 at 18826. It just missed crossing above the 18887 which is previous high levels touched on 1st December 2022.

Let us look at the overall Elliott wave perspective to understand the maturity of trend and if more steam is left over coming days.

Nifty hourly chart – 
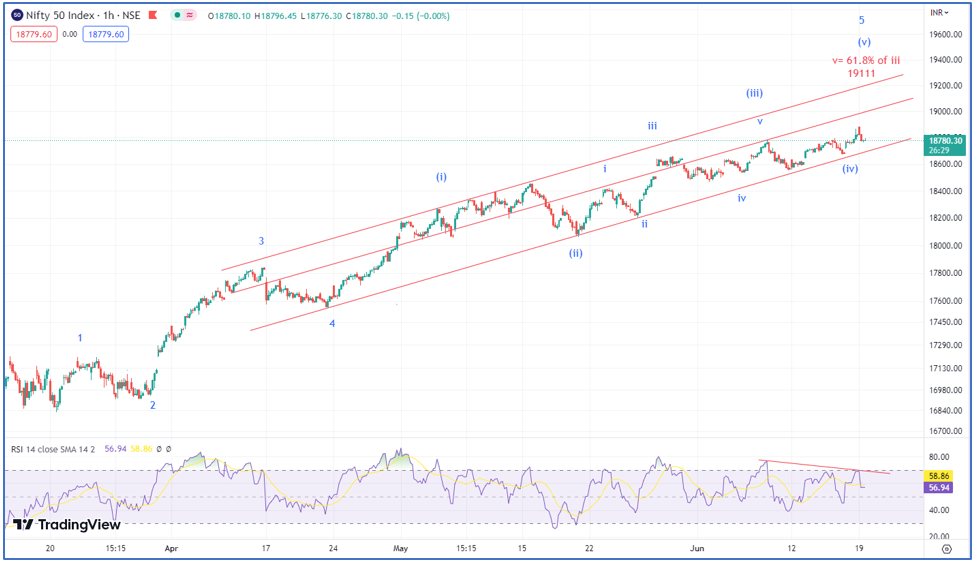
Elliott Wave analysis:

Nifty path ahead – As shown in Nifty hourly chart, rise from the lows of 16828 is in impulse pattern that consists of 5 waves. There is extension in wave 5. Prices are also moving in red channel and currently wave (v) of 5 ongoing. As per this Nifty can hit lifetime highs above 18887 levels and eventually move to the levels of 19111. This is where wave v is 61.8% of wave (iii).

Wave personality suggests that wave (v) is usually associated with slower momentum and we can see the same on the above chart where RSI is making lower highs with prices making higher highs.

It is prudent to avoid catching a top unless we see close below prior week’s low which is near 18530 over short term. For nearly 12 weeks there is not a single close below prior weekly low on index and so it is still buy on dips. Many are trying to catch a top here as the momentum is slower but do remember that prices can continue to rise with slower momentum unless price action confirms. 

Master of Cycles – Learn the science of Trading Time in simple step by step process. Hurst’s Time cycle technique combined with KST, Gann square of 9. This course is for everyone looking forward to increase their accuracy by timing the market and trade profitably using the scientific approach to trading. Online live event on 24th – 25th June 2023, Only a few seats left. 

Friday, January 5, 2018

How to identify Impulse patterns? Elliott wave on Stocks, Gold, Silver, Crude, Copper


Trading using Technical analysis, Elliott wave and charts on Stocks, Gold, Silver, Crude and Copper. Visit https://www.wavesstrategy.com for Commodity tips. Also see trade setup on Nifty, Bank Nifty and Stock tips.

Thursday, January 4, 2018

Power of Impulse pattern – Gold, Silver, Crude & Copper!

The below charts show power of impulsive pattern across the commodities – Gold, Silver, Crude and Copper.Many are fixated upon movement of equity markets which has been subdued since the start of New Year whereas commodity has been providing ample opportunities on the long side.
We have seen strong trending moves in Base metalsEnergy pack and Precious metals as well. See the below charts of different commodities published in today’s morning research report – The Commodity Waves short term update.
See how easy it is to trade an impulsive trend if you are placed the right direction. You might refer our previous articles on Copper and other metals as well where we captured the entire up move and we turned bearish post wave v completion which helped to capitalize on the past few days of correction as well.
MCX Gold 60 minutes chart:

MCX Silver 60 minutes chart:

MCX Crudeoil 60 minutes chart:

MCX Copper 60 minutes chart:

So, once you have the Elliott wave structure or pattern you now know the address of the market. Using this co-ordinate you can formulate the trading strategy and use appropriate indicators.
So, if we expect a trending move then Moving averages will provide good support to prices, whereas during sideways action Bollinger Bands will do the magic!
Along with charts, it is important to see the support and resistance levels which we give along with the research daily morning.
Get access now to “The Commodity waves short term update” and trade the asset where the opportunity lies. I believe we should be flexible in switching the asset to the ones that are trending. Right now, it seems Commodity is the place to be in – Subscribe Now here

In case you do not have time to analyse and read the charts yourself subscribe to our Intraday / Positional Commodity Tips services where we monitor and shoot the calls based on opportunities. We have been able to capture amazing moves on Gold, Copper and other metal space over past few days. Subscribe for Commodity Tips and get research report free. Get access here

Wednesday, November 2, 2016

Axis Bank: Why Impulsive move provide best trading opportunities?

Axis Bank has been leading the fall this time and yes the movement has been impulsive as per Elliott wave pattern.

Below research shows the internal counts of Axis Bank along with the bigger degree outlook. We turned bearish on this banking stock as soon as the fall looked impulsive and when it was moving down in 3rd wave.

It is not very often to see impulsive moves when majority of stocks and indices are moving in complex corrections. This simply shows trading becomes very easy if one can cite such impulsive behavior as predictability increases drastically.

Axis Bank daily chart:

Axis Bank 60 mins chart:

Wave analysis:

The below research is picked up from the daily research report “The Financial Waves short term update”

Yesterday in the overall banking sector selling emerged during the closing hour and Axis Bank from this sector turned out to be the major looser as it was down by 2.58%.

The daily chart suggests that post the completion of wave B at the highs of 640 levels now wave C has taken its place as the entire previous leg is taken out in faster time. The fall from the peak has breached the channel support along with the moving average line which was intact in the entire previous up move this suggest that medium term top is in place for this stock.

As shown in 60 min chart, prices are moving down in impulsive fashion within the red downward sloping channel. Currently from the highs of 540 levels a sharp fall was witnessed which suggest that minor wave v has taken its place. It looks to be subdividing further and the last minute leg of the same is completing its course.

In short, ………

The above research clearly highlights impulsive behavior in one of the major private sector banks. Nevertheless, always remember after completion of 5 waves on downside we will see upside part retracement of this down move which will provide better trading opportunity. So based on Elliott wave counts and pattern combining Risk reward ratio one can devise prudent trading strategy objectively without relying on news which are most of the times delayed.

Subscribe NOW and get access to your copy of this research that shows detailed technical analysis on stocks, Nifty, Bank Nifty and detailed Elliott wave counts, patterns in combination with various indicators. Also in case of queries you can always write back to us or post it on our Discussion Forum. For subscription option simply visit Pricing page and select Equity research report and we will set you up for daily research via Email and Client login section.

Wednesday, April 27, 2016

Nifty: Can you identify an impulsive or corrective pattern?

Elliott wave is all about recognizing the patterns. The first level of pattern segregation is to understand whether the rise is impulsive or corrective. An impulse pattern should consists of 5 sub-waves with waves 1,3, and 5 traveling in direction of the bigger trend and waves 2 and 4 correcting the prior impulse trend. Also as per basic Elliott wave following are the three rules that should be followed:

1. Wave 2 cannot retrace complete of wave 1

2. Wave 4 cannot enter into territory of wave 1

3. Wave 3 cannot be the shortest among the impulsive waves 1,3,5

When all of the above basic rules are followed then the pattern qualifies for an impulse pattern as per basic Elliott wave. Using Advanced Elliott wave – Neo wave a valid impulse pattern has to follow more than 15 rules. For now let us focus only on the basic rules and see if Nifty has been showing impulsive or corrective rise:

Nifty 60 mins chart:

The above chart of Nifty shows the rise from the lows of 6825 which is channelized. Now try to identify the pattern!

The rise does not have 5 waves following even the basic rules of Elliott wave forget about applying the advanced concept of Neo wave for pattern identification.

So the pattern is corrective. Now we have to identify whether it is a Zigzag, Flat, Triangle or Complex correction. Looking at the number of subdivisions and overlapping structure there is high probability that the complex correction is under formation. The next step will be to label the complex structure with internal counts. Always remember that pattern takes precedence over internal wave counts.

Now when you understand the pattern can you systematically label the internal counts which will in turn help in taking trading decision?

“The Financial Waves short term update” research report is published on daily basis that shows detailed Elliott wave structure applied along with other technical tools and advanced concepts on Nifty, Bank Nifty, stocks. For subscription options visit Pricing Page.