Showing posts with label How to trade Nifty. Show all posts

Monday, June 19, 2023

NIFTY: Path Ahead for Coming Weeks using Elliott Wave and Channel

 Nifty “closed” at lifetime high levels on 16th June 2023 at 18826. It just missed crossing above the 18887 which is previous high levels touched on 1st December 2022.

Let us look at the overall Elliott wave perspective to understand the maturity of trend and if more steam is left over coming days.

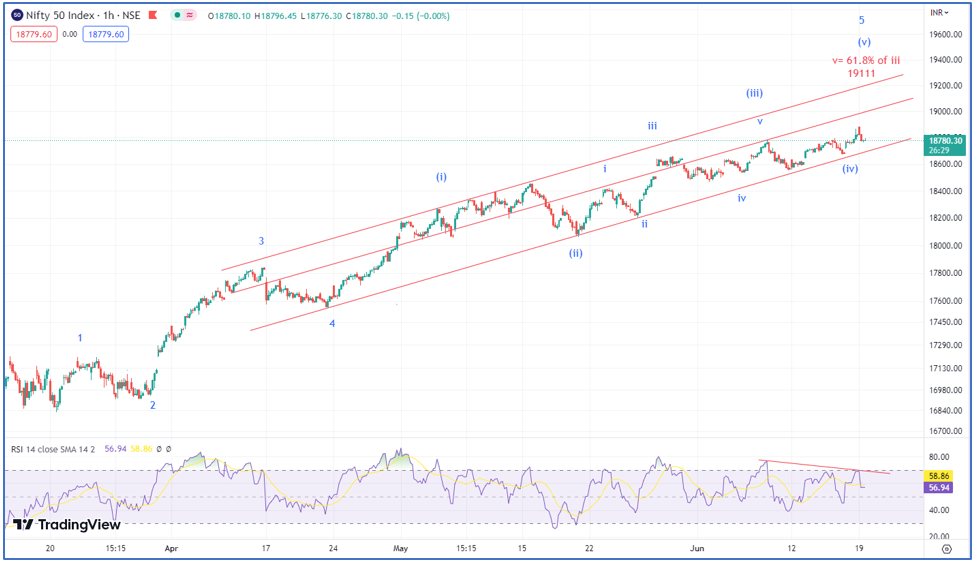
Nifty hourly chart – 
Elliott Wave analysis:

Nifty path ahead – As shown in Nifty hourly chart, rise from the lows of 16828 is in impulse pattern that consists of 5 waves. There is extension in wave 5. Prices are also moving in red channel and currently wave (v) of 5 ongoing. As per this Nifty can hit lifetime highs above 18887 levels and eventually move to the levels of 19111. This is where wave v is 61.8% of wave (iii).

Wave personality suggests that wave (v) is usually associated with slower momentum and we can see the same on the above chart where RSI is making lower highs with prices making higher highs.

It is prudent to avoid catching a top unless we see close below prior week’s low which is near 18530 over short term. For nearly 12 weeks there is not a single close below prior weekly low on index and so it is still buy on dips. Many are trying to catch a top here as the momentum is slower but do remember that prices can continue to rise with slower momentum unless price action confirms. 

Master of Cycles – Learn the science of Trading Time in simple step by step process. Hurst’s Time cycle technique combined with KST, Gann square of 9. This course is for everyone looking forward to increase their accuracy by timing the market and trade profitably using the scientific approach to trading. Online live event on 24th – 25th June 2023, Only a few seats left. 

Wednesday, December 3, 2014

Nifty: Money Flow index warning sign! Price confirmation still awaited!

Bottom Line: Mr. Rajan continued to surprise the Bond traders by keeping rates unchanged despite Bond yields easing!

Nifty daily chart:


 Nifty 60 mins chart:
Wave Analysis:
Mr. Rajan continued to act stringent to curb inflation despite the peer pressure and kept the key rates unchanged. The bond trader was caught off guard as the easing bond yields did not help in rate cuts. Since Mr. Rajan has taken over the bond traders are continued to be surprised. Trust me once we see fall in equity prices, RBI will be forced to take steps cutting down interest rates. As falling equity prices is a mirror of how economy is going to perform few months down the line. Looking at current scenario there is a possibility of first rate cut to happen in February 2015.

As soon as the policy decision was announced, Nifty entered into green territory atleast momentarily. This only showed markets have been waiting for news irrespective whether there will be rate cut or not. The index made a low of 8504 and traded in the range of 8540 and 8510 for most part of the day.

An interesting observation is that during the entire up trend from 7723 to recent highs there have been maximum of 2 consecutive red bars formation. Infact, in the entire up move from 5960 made in February there has been only a few times when there were consecutive 3 red bars and each time this resulted into increase volatility or deeper retracement either in terms of price or time. So far prices have formed 2 red bars and it will be crucial to observe whether Nifty can manage to close above previous close today or not.

Money Flow index measures volume along with price momentum. It indicates if money is flowing in or out of the index. It essentially a volume weighted momentum indicator. As can be seen on daily chart there is a strong negative divergence when this indicator is making a lower low against prices making new highs. We have highlighted previous such instances that resulted into atleast temporary halt in uptrend if not a strong downside correction. A break below 8460 is important for deeper downside retracement. However, it will be crucial to watch the 30 levels on Money flow index since everytime it reached there, prices bounced back on upside. First thing first, it will be crucial to observe if Nifty can manage to protect the level of 8460 and bounces back on upside in form of wave (v) of v of c. This wave counts will remain valid as long as 8670 is not taken out on upside else we will be forced to end wave (ii) of v at yesterday’s low in form of irregular Flat correction.


In short, Nifty has continued to trade in a challenging environment and no clear trending direction. Move below 8460 followed by 8430 will be bearish whereas close above 8560 is necessary for positive trend to resume!

Subscribe now for the daily research report "The Financial Waves short term update" and see yourself why Indian markets are at very crucial juncture. The daily morning research will give insight in stocks and other indices as well. For subscription options visit http://www.wavesstrategy.com/index.php/store.html 

Friday, August 16, 2013

Nifty interim update

Interim Update Bottom Line:

Nifty has failed to show any recovery signs throughout the day. The down move of around 180 points close was previously seen in 2011. The current move has opened a number of plausible scenarios from here on. It is better to wait for clarity before concluding if today’s is just a panic selloff and bounce back is possible or start of another leg on downside has started. Avoid creating any fresh positions and long positions can keep 5480 as stop. Also it is better to be in Options rather than Futures to avoid the event risk which we have seen before on Monday’s known as Black Monday. Also do not be too stringent with that level since many important supports have already broken! Also risk reward does not warrant fresh shorts here.

In short, wait for few more days of price action to devise a trading strategy!

For more information on daily report subscription visit
http://www.wavesstrategy.com/index.php/store.html