Friday, July 29, 2022

Will Nifty cross 17227? Major Volume Profile and #Gann Level


I will be teaching timing tools using Hurst and Gann time theory over the period of months of Mentorship starting from July 2022. If you want to be a part of this exclusive group simply register here - https://www.wavesstrategy.com/mentorship OR Contact us on +919920422202

We would love to connect with you on Social Media: 


----------------------------
"SEBI “Research Analyst” No: INH000001097
Write to us on : helpdesk@wavesstrategy.com 
Contact us: +91 9920422202 

Thursday, July 28, 2022

Nifty Ichimoku Cloud with Neo wave, Why 16740 Immediate support?

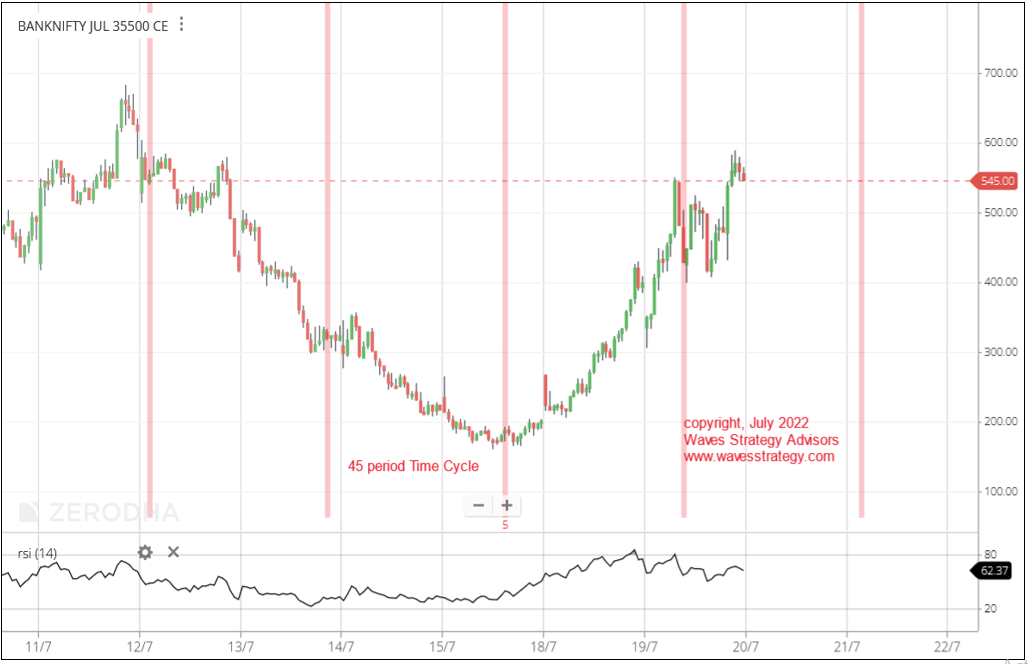
 Neo wave and Ichimoku Cloud is one of the most objective way of trading. Nifty has been moving very precisely as per Time Cycles and also as per Elliott wave patterns.

Ichimoku cloud helps traders to stay in the direction of the trend and provides important support or resistance zone along with Price action.
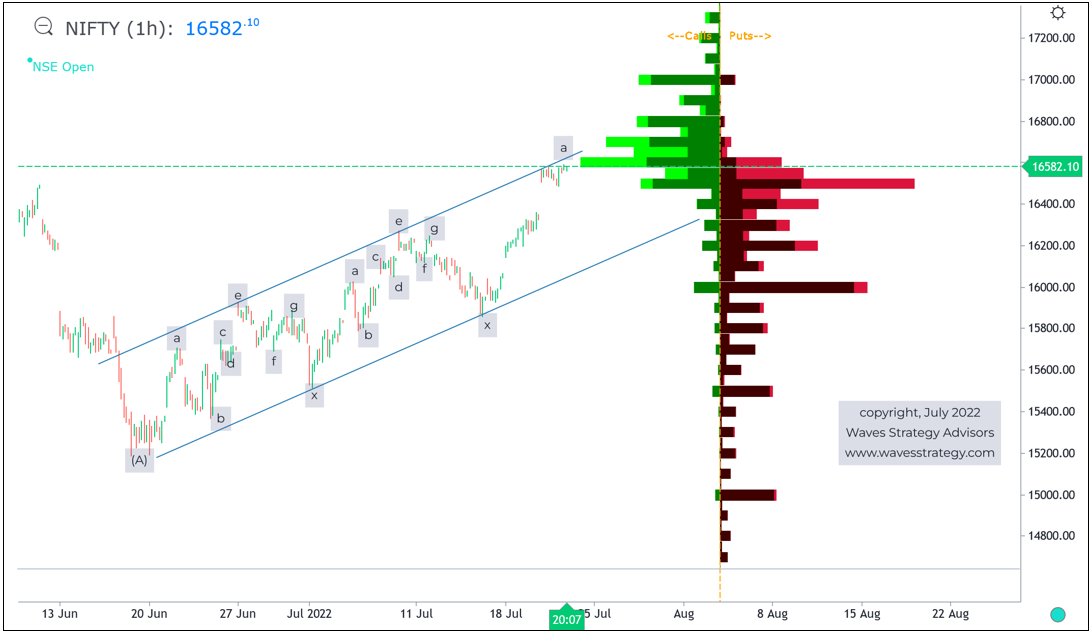
Nifty hourly chart:

Nifty Neo wave counts from the lows clearly suggest prices are moving in form of triple corrective pattern on upside.

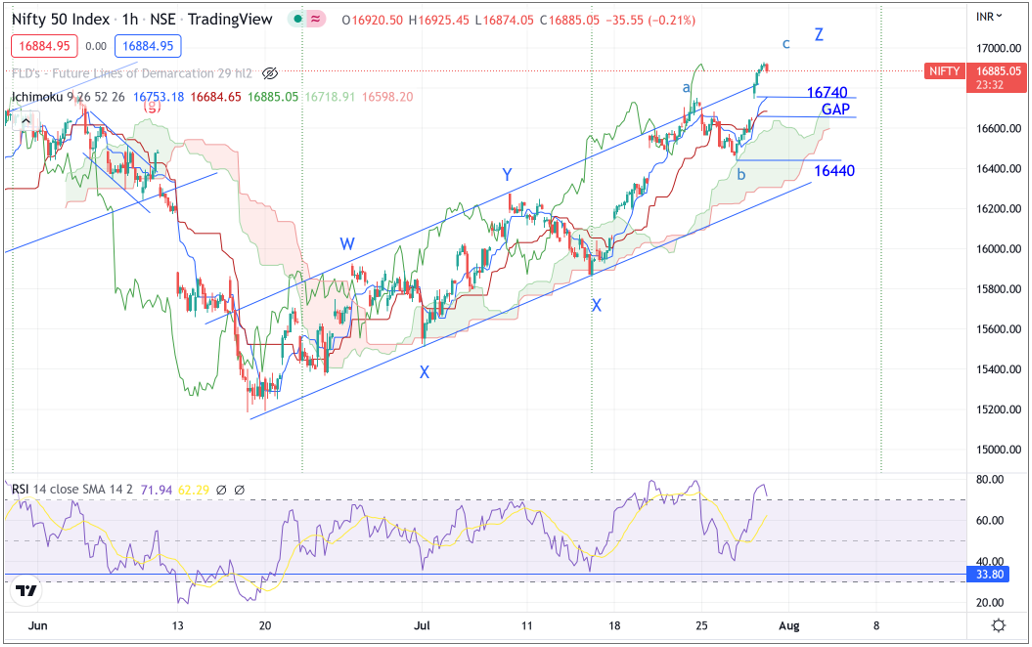
By simply trying to combine the movement as per Ichimoku cloud one can make out that whenever there was a dip towards the lower end of the cloud it concluded wave X .

The recent dip we saw towards 16440 was minor wave b as prices found support towards the upper end of the Cloud and bounced back sharply from there.

US Fed announced rate hike of 75 bps as inflation crosses 9.1% in US. This is a huge rise but despite of that global markets have continued to move up. So majority of the traders who were sitting on side-line due to FED meet have simply failed to capitalize on the ongoing up move. Therefore market movement is independent of events and news can only result into short term volatility but the trend remains unchanged.

Gaps: act as important support or resistance to prices. We can see that immediate support is at 16740 followed by 16600 which is Cloud as well as major Gap support.

Neo wave suggests that wave b took lesser time compared to wave a and so the ongoing pattern after wave X is either a Diametric or Extracting Triangle. It is best to use dips to buy as long as 16440 is protected since if Diametric pattern is ongoing we might have more legs before a major reversal will happen.

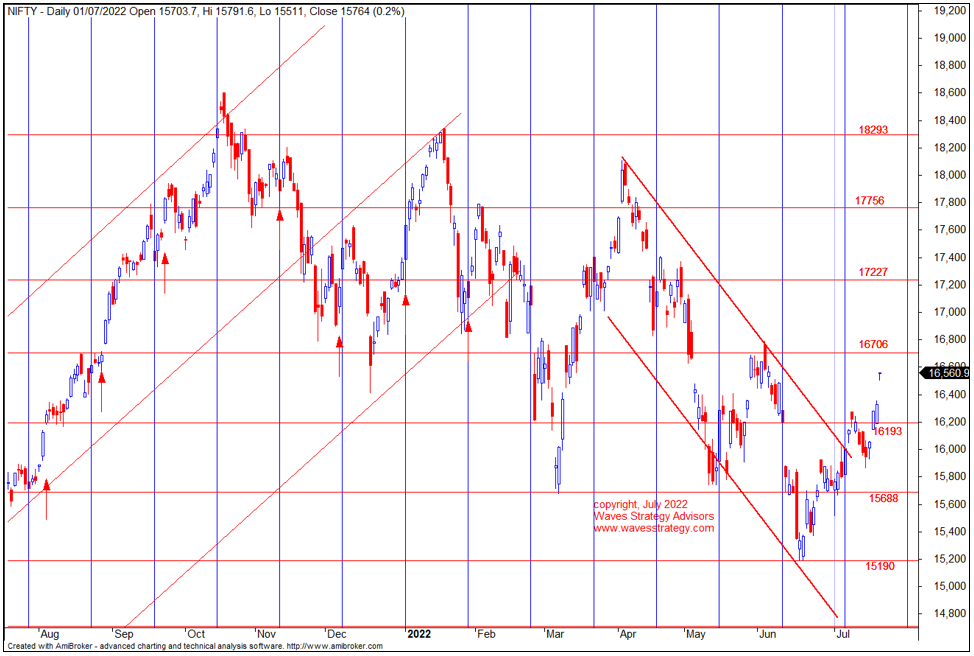
In a nutshell, by combining Ichimoku Cloud with Neo wave and Price action one can form excellent trade setups. Upside levels to watch basis of Gann square of 9 is 17227 levels.

Learn to Trade using this scientific approach to markets in 3 months of Mentorship which will focus on Gann methods, Time Cycles using Hurst’s methods and Wave concepts. It does not matter even if you are fresher because we will be taking step by step approach to trade markets. Limited seats only, Mentorship starts on 30th July 2022, get immediate access today before the live trading sessions, Fill the form here for more details.

Friday, July 22, 2022

#Nifty Trading using #Gann Square of 9 - Get amazed


I will be teaching timing tools using Hurst and Gann time theory over the period of months of Mentorship starting from July 2022. If you want to be a part of this exclusive group simply register here - https://www.wavesstrategy.com/mentorship OR Contact us on +919920422202

We would love to connect with you on Social Media: 


----------------------------
"SEBI “Research Analyst” No: INH000001097
Write to us on : helpdesk@wavesstrategy.com 
Contact us: +91 9920422202 

Thursday, July 21, 2022

Nifty Neo wave with Open Interest profile

 Nifty has continued to move sharply higher over past two days and moved from lower channel support towards the upper channel resistance.

Neo wave gives a clear perspective on the direction of the market and what to expect next.

Nifty 60 minutes chart:

After the low formed near 15190 near the Gann square of 9 levels mentioned in previous article we are seeing sharp upward rally. Channels work extremely well and prices are near the resistance of this upper trendline.

Neo wave analysis: Entire rise from the lows is in form of triple corrective pattern. Complex correction involves “x” waves. It connects two standard corrections together. We can see that Diametric pattern (7 legged correction) is connected by wave x and then again a Diametric pattern. After that the fall was arrested near the trendline support and formed one more x wave. Not the third corrective pattern is ongoing and given the steepness of rise it can only be wave a.

We can form either a Zigzag, Triangle or Flat pattern. The internal of wave a is like a single mono wave and so it is better to wait for wave b to start. This wave b will give extremely important information for traders who can then ride wave c and possibly reversals post that. The extent of retracement of wave b will hold the key for wave traders.

Open Interest analysis: We can see 16500 has shown sharp rise in open interest on put side but 16600 has also shown rise in call side OI. This is indicating a possible range bound movement for now with 16500 acting as a magnet. This OI behaviour is suggesting wave b can move between 16400 – 16600 levels, before any trending move on emerge.

In a nutshell, Option traders can accordingly form short option strategy given the forecasting ability of Neo wave – advanced Elliott wave and Open Interest analysis.

Mentorship on Trading – Learn to trade with an edge of Time along with Elliott wave and Neo wave concepts with detailed application on Options. Limited seats only, This will change the way you ever look at the markets. Know more

Wednesday, July 20, 2022

Nifty Gann Square of 9 with 18 Days Time, Next Target 16706 – Why?

Gann square of 9 is simple yet powerful way to understand price action areas for targets and stoploss.

Below chart shows important support and resistance on basis of which trades can be derived using Gann square of 9 methods.

Nifty daily chart:

Gann method - In above chart we can see horizontal lines with price mentioned on it. These numbers are not random but are derived using Gann square of 9 method. The angle used is 180 degrees. This angle has been able to capture most of the important tops and lows.

The intermediate low formed at 15190 was Gann square of 9 level, post that we saw multiple attempts to take support at 15688 which was again a Gann number. Post that the push on upside was halted near 16193 and on 19th July 2022 this level was decisively broken thereby opening up next destination as 16706.

18 Days Time cycle – we can see important upside reversal on most of the occasions in about 18 days. This time cycle has worked well if combined along with Gann square of 9 method. We can clearly see that after bouncing from 15688 the time also turned on buy side on 6th July 2022. So price and time got in sync and Nifty moved from one Gann level to another.

The above simply shows that instead of deriving price action areas by looking at prior tops or lows one can derive using scientific method of Gann square of 9 which is suggesting next zone as 16706. It is not necessary to reach there directly, there can be speed breakers in between but this is where we can see profit booking and reversals.

Learn to Trade using this scientific approach to markets in 3 months of Mentorship which will focus on Gann methods, Time Cycles using Hurst’s methods and Wave concepts. It does not matter even if you are fresher because we will be taking step by step approach to trade markets. Limited seats only, Mentorship starts on 30th July 2022, get immediate access today before the live trading sessions, Fill here form for more details

Tuesday, July 19, 2022

Bank Nifty Option Trading using 15 Minutes Time Cycle

 Time Cycles are powerful way to Trade and Time the markets. Bank Nifty Options with Time techniques shows simple and powerful way of Trading.

Bank Nifty is following Time cycle of 89 period and 45 period on 15 minutes time frame.

Bank Nifty 15 minutes chart 35500 Call option:

Above chart shows 45 period Time cycle applied on Bank Nifty 35500 call option.

It clearly shows that this cycle actually helps to capture the lows with minor pullback during downtrend and major rally during the uptrend.

We can see a sharp rise in option price from near 180 to 545 levels in less than 2 days. Also on 19th July the call option formed a low precisely on the Time when this was due near 12 pm and rallied by from 400 to 590 in less than 2 hours. This clearly showcase that by combining these simple time trading techniques one can trade with an edge. If time turns up, prices will follow and this is what we can see on

Bank Nifty in the above chart.

Also, the above we are showing not after the move has happened but also we discussed Bank Nifty time cycles on 16th July 2022 Exclusive free webinar deriving the Date as 19th July and time as 12pm much earlier before the move seen today.

Mentorship on Timing the market – Imagine for 3 months we will be looking at various techniques to time the trades using Simple methods and step by step approach from scratch to Timing the trades, complete Handholding, stock selection methods, Option trading strategy with clearly defined trade setups, Be a part of this Elite trader’s community - #TimeTraders, Limited seats only, Fill form here for more details

Monday, July 18, 2022

Trade to win Again Khiladi No. 1 on @CNBC Awaaz


I will be teaching timing tools using Hurst and Gann time theory over the period of months of Mentorship starting from July 2022. If you want to be a part of this exclusive group simply register here - https://www.wavesstrategy.com/mentorship OR Contact us on +919920422202

We would love to connect with you on Social Media: 


----------------------------
"SEBI “Research Analyst” No: INH000001097
Write to us on : helpdesk@wavesstrategy.com 
Contact us: +91 9920422202