Tuesday, November 29, 2022

Reliance Trading Using Volume Profile – Is it BIG Trend start?

Volume profile is different than normal Volumes that majority is tracking. Volume profile showcase behind the scenes big players activity and at which price point positions are created.

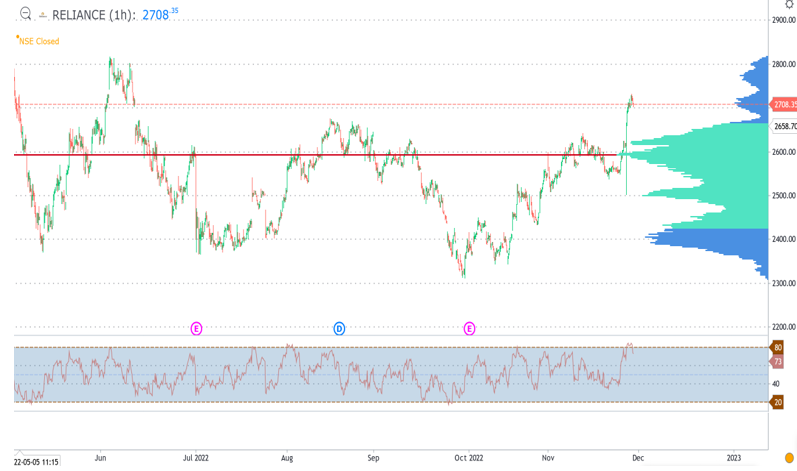
Below is the chart of Reliance Industries which we discussed during the Exclusive webinar on 27th November 2022.

Reliance hourly chart – Anticipated on 27th November 2022
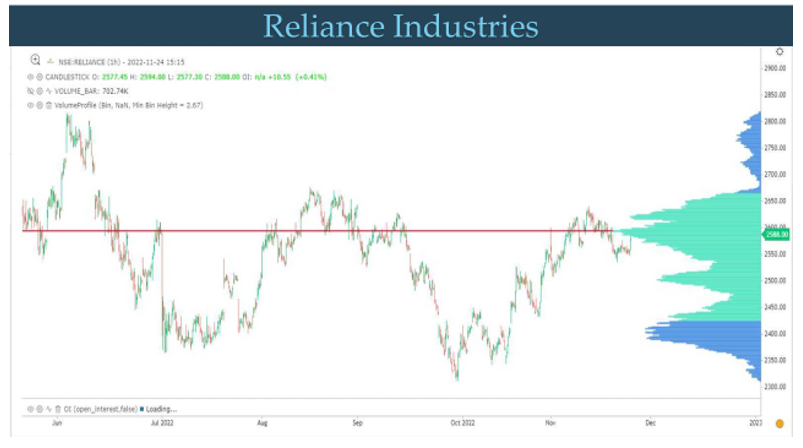
Reliance hourly chart - Happened

As seen in 1st chart, Reliance Industries approached the red line which is Volume point of Control (VPOC) that showed major accumulation took place near the zone of 2600 levels. As soon as this major Price action area was crossed there was sharp jump on upside and the stock rallied by nearly 4% in single day which is rare.

There are different shapes to Volume profile as well and for trader it is important to keep a track of a few concepts from this technical analysis study.

In a nutshell, Reliance Industries now have major support near 2600 and as long as this level is intact any dip can be used as buying opportunity. Simple price action using Volume profile can be a great indicator for Option Traders.

Learn to Trade Options using Technical Analysis (OTTA) using Volume profile, Open interest profile, Option Strategies, Payoff chart and much more scheduled on 10th – 11th December 2022. Early Bird Ends on 30th November. Know more here
Monday, November 28, 2022

Bank Nifty Elliott Wave & Fibonacci - GPS Path Ahead

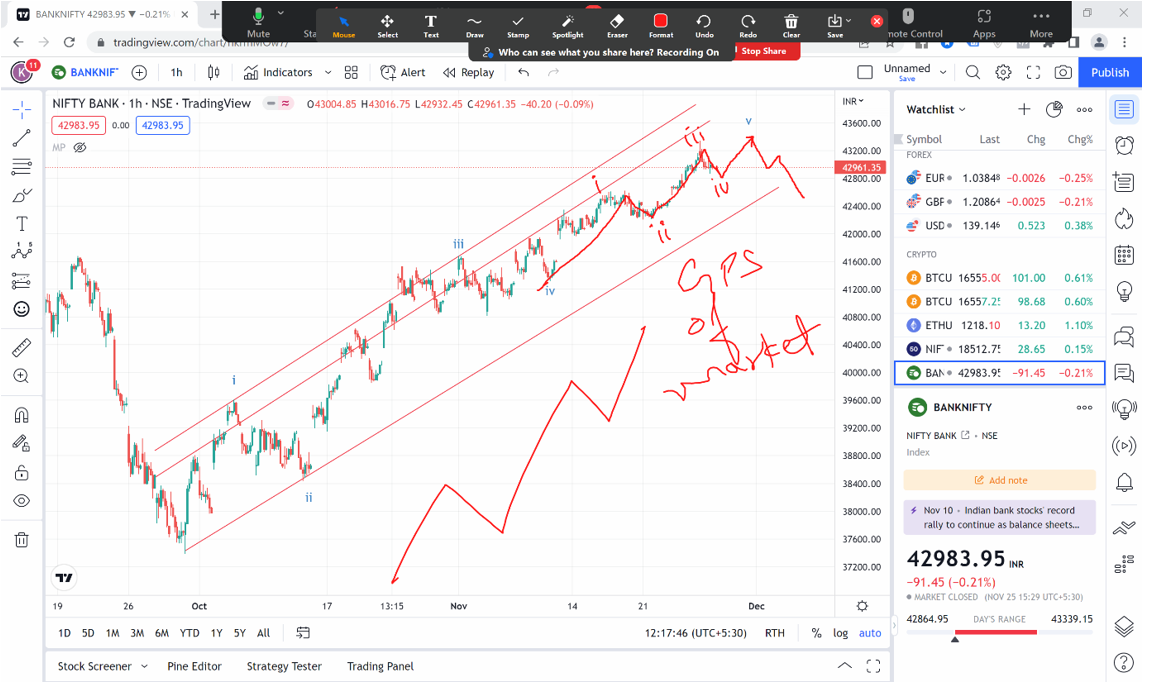
Elliott wave is GPS of market along with Fibonacci helps to understand Targets, Stoploss and maturity of trend.

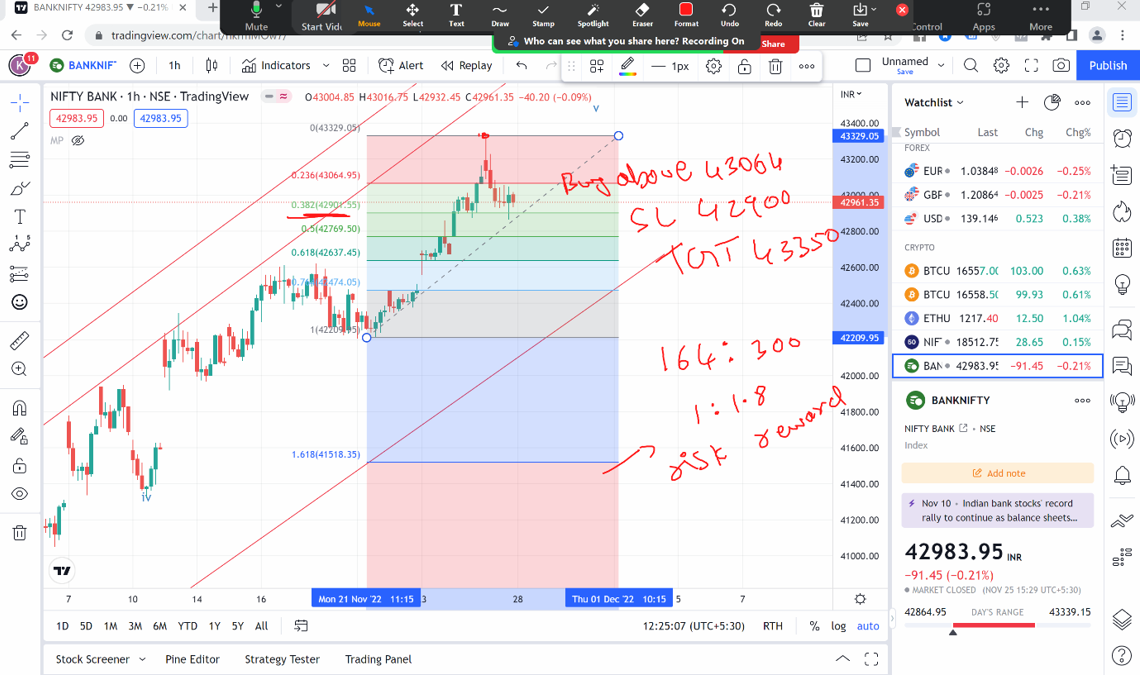
Below chart of Bank Nifty was discussed during the Exclusive live webinar on 27th November 2022 with 1000s of participants where we derived possible path for this index.

Bank Nifty hourly chart (anticipated on 27th November)

Bank Nifty Trade basis of Fibonacci

Bank Nifty in today’s session is already breaking above the resistance of 43064 levels, Nifty touched lifetime high levels. The overall undertone is positive as long as we do not see close below the previous day’s low.

Post completing wave v on upside we can expect retracement of the up move. However, that has to be driven by two stage confirmation as per Neo wave – Advanced Elliott wave technique.

By combining simple price action along with Fibonacci and Elliott wave one can derive complete trade setup for Nifty, Bank Nifty and stocks.

In a nutshell, Bank Nifty trend looks positive as long as 42900 remains intact on downside for upside targets of 43350. It is important to understand this is game of probability and one should always trade when the probabilities are favourable.

Most advanced Training on Technical Analysis - Learn the science of Trading Options using Volume profile, Open Interest profile along with Elliott wave and Neo wave in upcoming Become Market Wizard (BMW) program which is comprised of two courses Options Trading using Technical Analysis (OTTA) on 10th – 11th December 2022 and Master of Waves on 7th – 8th January 2023. To know more fill below form - https://www.wavesstrategy.com/bmw/

Tuesday, November 22, 2022

Nifty Trading Using Pring KST Buy Sell Signal

KST Indicator (Know Sure Thing) developed by Martin Pring is a powerful Time indicator.

KST indicator takes summation of multiple Rate of Change (ROC) together and smoothens it using an average. The signal line which is again an average of KST is plotted to get Buy and Sell signals.

Nifty Daily chart with Pring KST

Above Nifty daily chart shows important tops have been accompanied by turn in KST indicator. Do note that KST (green) moving below the signal (red) line does not always lead to lower prices. We can see that happening during the rise of October 2021 where KST was falling below the signal line but prices showed sharp move on upside.

Price Action with KST – It is therefore important to combine price action along with any indicator. KST is a Time indicator which is very smooth as against ROC applied directly. It does indicate that trend can possibly reverse and it is time to be alert. We can see that all the tops of Nifty over past year has been accompanied by the KST crossing below the signal line and so one can then devise a strategy to short the market on pullbacks unless KST moves back above the signal line. Shorter time frames can be combined along with daily for timing the entries.

In a nutshell, Nifty daily KST is still in buy mode whereas hourly and smaller time frames entered sell. So, during such scenario Options selling can work better. When daily KST moves below signal line followed by 0 line there can be a great opportunity to keep using smaller time frames for sell signals to trade the major trend.

Premium Trading Strategy – Get the complete trade plan looking at KST along with Price action and Bollinger Bands in just 2990 /- course over here

Become Market Wizard – Learn the science of Trading Options using Volume profile, big players activity, Open interest profile, Ichimoku Cloud and much more in Options Trading using Technical analysis (OTTA) combined with Master of Waves (MOW) – Elliott wave, Neo wave with Hurst’s Time Cycles. Both these courses together form BMW  - know more here

Monday, November 21, 2022

Nifty Neo Wave Pattern – Is the Top in place?

 Elliott wave or Neo wave act as GPS of the market. It is advanced Technical analysis study that can help traders understand if the trend is matured and about to reverse to catch important tops or lows.

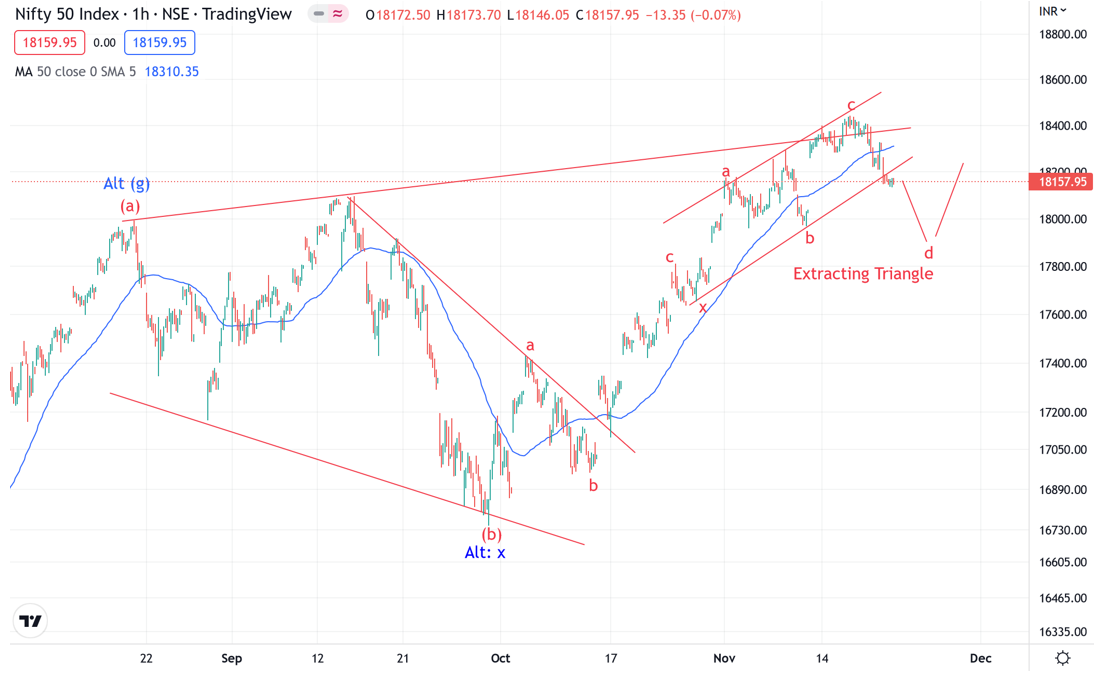
We are showing hourly chart of Nifty that gives the possible path from here on.

Nifty 60 minutes chart:

Elliott wave analysis – As shown in above chart we can clearly make out that prices are moving in the form of corrective pattern and currently is in wave c. The entire structure looks expanding and we can see it failing to sustain above the upper trendline.

From Neo wave perspective, the internal structure of wave (c) seems to be double corrective. Post wave x the ongoing pattern is Extracting Triangle and currently wave d looks to be in progress. Ideally this wave d should break below the low of wave b near 17990 levels and then one pullback on upside is possible.

However, do note this is only an assumption as the pattern can also turn out to be a Diametric on upside. So one should know when to change the stand from bearish to bullish. On upside 18340 is now major hurdle which is also the Gap area. Move above this level will indicate wave d is over and ongoing pattern will then turn out to be Diametric with more bullish possibility. This will remain alternate scenario.

Thus by understanding the ongoing pattern it is possible to trade with probability in favour and one can derive prudent stoploss for positions. Neo wave is amazing tool for forecasting future and one can trade Options or Stocks extremely well once this technique is understood.

In a nutshell, Nifty short term view is bearish and there is possibility that we might start moving lower towards 17840 – 17800 levels. This is valid as long as 18340 remains intact on upside.

Subscribe to Equity research “The Financial Waves short term update” and see yourself application of these methods with Nifty, Bank Nifty, Stocks that are providing good opportunity. Subscribe here and receive research directly on Telegram

Subscribe to Premium Telegram group for Stock Futures calls over here 

Become Market Wizard (BMW) – Learn to trade Options along with simple technical concepts and combine that with Elliott – Neo wave analysis, BMW is comprised of Options Trading Using Technical Analysis (OTTA) and Master of Waves (MOW). Know more here

Tuesday, November 15, 2022

Nifty Intraday Trading Using Volume Profile

 Volume profile highlights accumulation or distribution area by big players. It is the zone where major activity has taken place during the day or week.

By understanding volume activity one can know crucial support during the day.

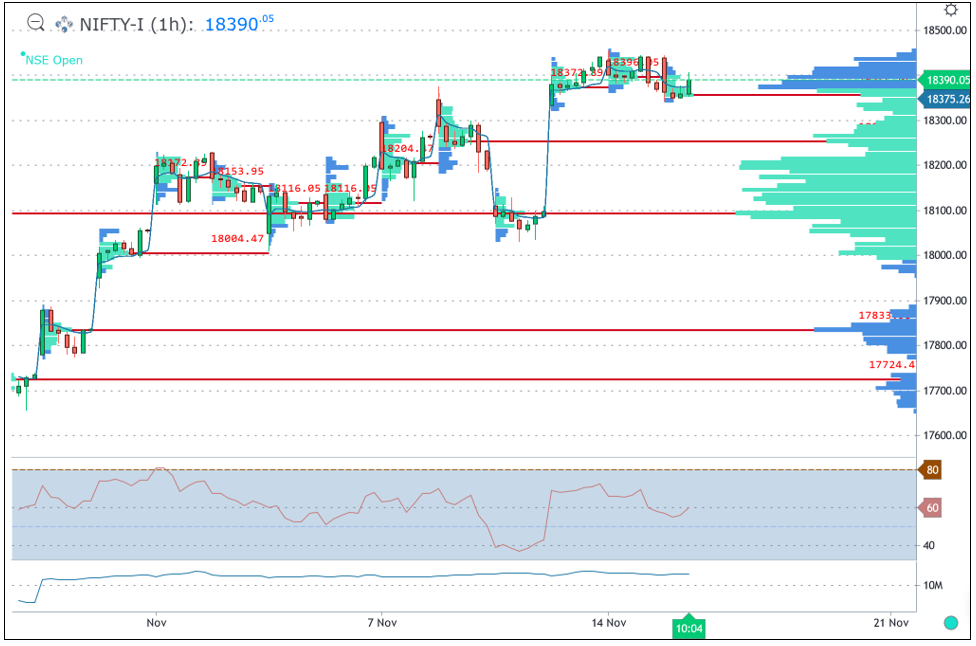
Nifty hourly chart – Volume profile with VWAP

Above chart shows volume activity during the day along with cumulative volume profile across multiple time frame.

We can see that major volumes have taken place near 18375 (fut) levels which is the highest volume profile area on 15th November and also on 13th November 2022.

Cumulative volume profile shows Point of Control – are of highest volume near 18090 (fut) levels. So, big players have created their positional trades near this level.

VWAP – Volume weighted average price reflects the average where the volume has happened during the day. Prices usually find support near the VWAP and Volume POC.

These are pure insights into big player’s activity and where they are creating the positions.

In a nutshell, by looking at this simple volume technique we can make out that support as per volume profile is near 18375 (fut) followed by 18250 which is also middle of the Gap area. So market will remain buy on dips as long as 18090 is intact where big players entered the market.

Learn the science of Trading in Mentorship – Trading is a science of probability. Such simple ways of looking at the markets can enhance your trading skills along with Options breakout strategy. Be a part of elite trader’s community we call as #TimeTraders. Fill the form here for more details

Thursday, November 10, 2022

Algo Trading क्या होता है ? | Ashish Kyal | Time Trading Strategy


Algo trading or Algorithm trading is the process by which computers are programmed to carry out trades based on predefined instructions called Algorithms. So, if you’re an active trader, we recommend that you use one of the above Algo trading strategies to enter and exit stocks with accuracy and efficiency. This will maximize the return on your capital. 

Learn the science of Timing the market over more than 3 months with lifelong association, live trading sessions, Algo creation and everything focusing on Time trading, Register here - https://www.wavesstrategy.com/mentorship OR Contact us on +919920422202 

We would love to connect with you on Social Media:


----------------------------
"SEBI “Research Analyst” No: INH000001097
Write to us on : helpdesk@wavesstrategy.com 
Contact us: +91 9920422202 


Thursday, November 3, 2022

Nifty 5 Minutes Trading – 3 Powerful Techniques for Intraday!

3 Powerful Indicators that one must be aware of while Trading Intraday.

We use Neo wave along with Time Cycles and Channels to understand the maturity of trend, reversal signs and catch powerful explosive moves just before it starts.

Below is Nifty 5 Minutes chart showing these techniques all combined together.

These are simple yet powerful way to trade.

Nifty 5 Minutes chart:

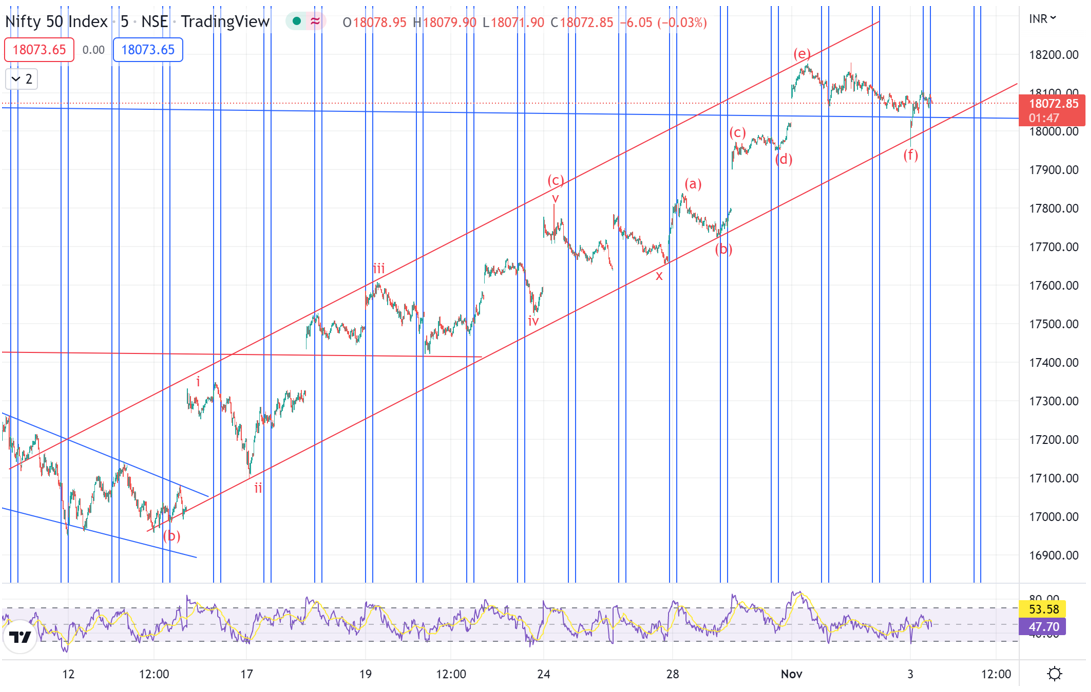
Neo wave analysis – Above chart of Nifty shows clearly the internal Elliott wave pattern forming. We can see that prices completed wave (c) in form of 5 waves up and post that there was an x wave formation. After that the entire rise seems to be forming a classical Diametric pattern which is labeled as a-b-c-d-e-f-g and prices are currently in wave (g) which means matured stage of up move. Low made near 17960 on Gap down is now the crucial support as break below it will also breach the channel that has been protected in this entire rise and will also confirm wave (g) up is over.

Two stage confirmation is powerful technique again in Neo wave and it virtually guarantees when the trend is over with high risk reward trade setups.

Time Cycles – This is next powerful indicator that we use to understand enter the trend when the time is right. For Option traders if timing goes wrong making money is near to impossible. 5 minutes Time cycle period of 64 is working just amazing. Look at the start of most of the up waves precisely from this cycle low.

Channels – Next powerful technical analysis method but ignored by majority of traders.

In a nutshell, Nifty is in matured stages of up move, with 17960 as important support and 18180 as hurdle.

All of the above methods are price and time focused and not derivative of it. So it is important for trader to use this simple yet powerful techniques and see transformation in the way they can trade. Trading should be fearless when you can see the future possible price action.

Mentorship on Timing – Early Bird ends in 2 days with benefits of Lifetime access to Bonus videos, discounted pricing ending soon! Time is now to become a profitable trader. Act now to take charge of your trading career. Fill the form here for more details - https://www.wavesstrategy.com/mentorship/

Wednesday, November 2, 2022

Bank Nifty - Will it Cross 42000 or Time to Get Cautious?

Bank Nifty has continued to inch higher along with Nifty but is it sustainable or time to book profits?

Elliott wave helps us to understand the overall maturity of trend. It is GPS of the market and we are applying it on Bank Nifty as shown below.

Following research is picked up from daily equity research report – The Financial Waves short term update

Bank Nifty daily chart

Bank Nifty hourly chart

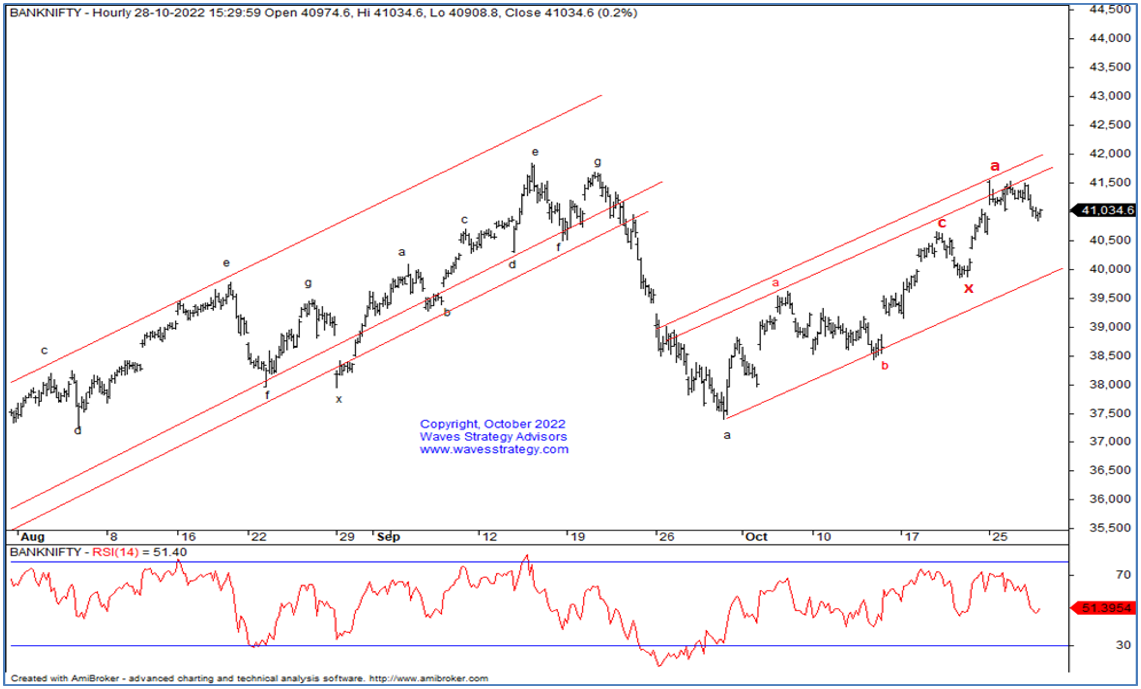
Elliott wave analysis – As shown on daily chart we can see Bank Nifty is back towards the previous top made in August 2022. However, this rise is slower and we can see there is no strong trend as ADX is declining which indicates range bound move over medium term.

From Elliott wave perspective prices are moving in form of wave (e) of possible Neutral Triangle pattern as defined in Neo wave. This is usually the last leg of up move before a reversal happens from medium term perspective but price action is important.

Over short term, we can see that the rise is slower as compared to fall in form of wave a. This entire up move is possibly in form of double corrective pattern involving x wave. Channel support is at 40,000 and dips can be used to buy over short term for a move towards 41500 – 41800 levels.

In a nutshell, overall trend for Bank Nifty is up over short term but matured from medium term perspective. 42k is going to be major hurdle. On downside 40k is crucial support, as long as this level is intact one can buy on dips for target of 41500 – 41800 levels.

Elliott wave along with other technical analysis method can act as powerful trading system. This requires a Mentor who can handhold, guide, discuss as the pattern progresses.

3 Months of Mentorship on Timing the Markets – Learn to Time the market along with application of Time cycles, Neo wave and simple yet powerful trend following methods, stock selection Algos, Momentum stocks, Multibagger portfolio, risk and money management, Live Trading sessions, Options trading. All of this will be part of Mentorship with step by step approach to trade with high conviction, access to private Telegram group for lifetime, Early Bird Ends on 5th November, Fill the form here for more details - https://www.wavesstrategy.com/mentorshipoffer

Tuesday, November 1, 2022

Why #Mentorship on Timing the Market for Successful Trading?


Learn the science of Timing the market over more than 3 months with lifelong association, live trading sessions, Algo creation and everything focusing on Time trading, Register here - https://www.wavesstrategy.com/mentorship OR Contact us on +919920422202 

We would love to connect with you on Social Media:


----------------------------
"SEBI “Research Analyst” No: INH000001097
Write to us on : helpdesk@wavesstrategy.com 
Contact us: +91 9920422202 

Nifty Trade Setup, Momentum Stocks on @CNBC Awaaz. | Ashish Kyal


Nifty trade setup with key levels and stocks to trade discussed by stock market Expert Ashish Kyal, Author, CMT

Learn the science of Timing the market over more than 3 months with lifelong association, live trading sessions, Algo creation and everything focusing on Time trading, Register here - https://www.wavesstrategy.com/mentorship OR Contact us on +919920422202 

We would love to connect with you on Social Media:


----------------------------
"SEBI “Research Analyst” No: INH000001097
Write to us on : helpdesk@wavesstrategy.com 
Contact us: +91 9920422202