Monday, August 29, 2022

Nifty Crashed – 55 Days Time Cycle, Channel, Neo Wave – BANG ON!

 Nifty moved from near 18000 levels making a low of 17168 today post the FED meeting on 26th August. But this was predictable precisely as per Time and Neo wave pattern.

We have been warning since more than a week that we can see a crash and published it on YouTube as well – Here is the link if you missed seeing the webinar on 12th August – check here

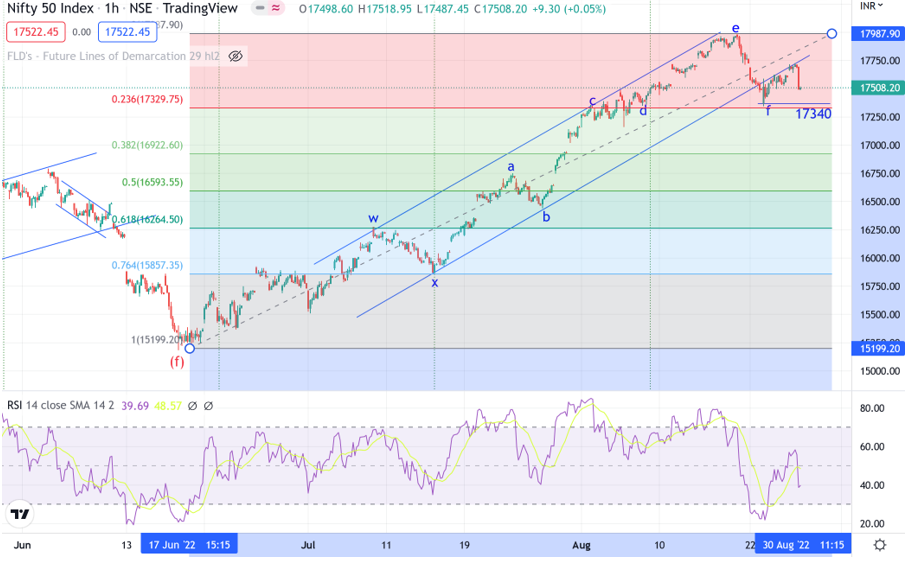
Following chart was shared to our clients which simply showed why we are nearing a top again at 18k when majority were super bullish for 18500++ levels.

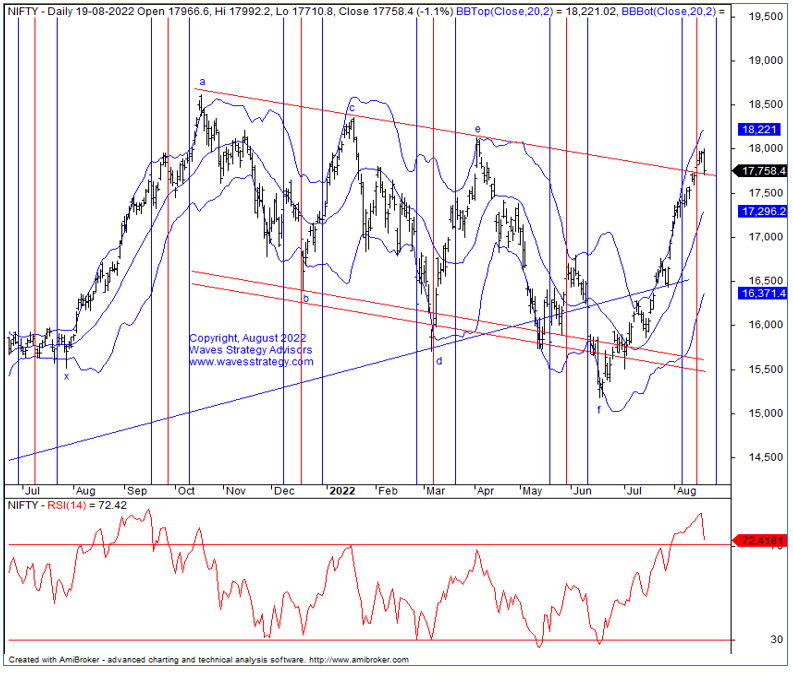
We have been able to capture every single top on Nifty including the one formed in October 2021 near 18600. Many not ready to accept the facts presented at that time due to biasness and euphoria prevailing at that point of time. See the below charts:

Nifty Daily chart – Anticipated on 12th August 2022


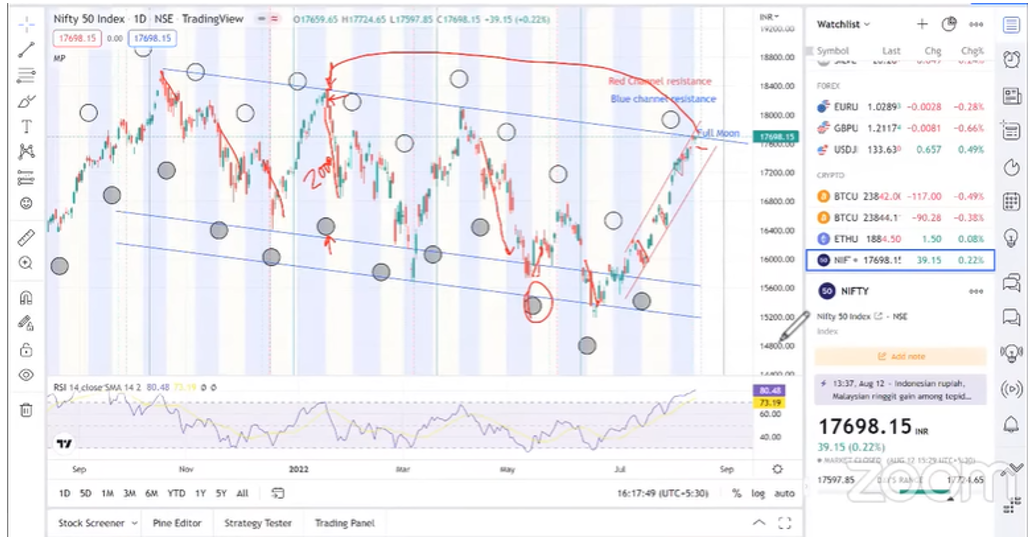
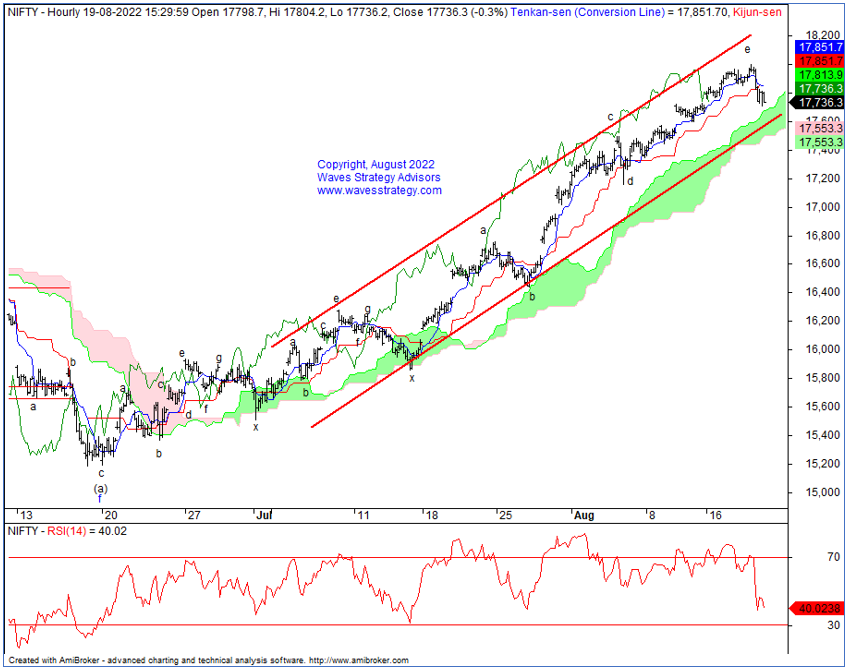
Anticipated – Live streaming was done on @kyalashish YouTube channel with the headline - Nifty Lunar, 55 Days, Neo + OI! Nifty Crashed 2000 Points last time, Will it repeat? You can see it here

Nifty daily chart – Anticipated on 26th August 2022 much before the FED meet


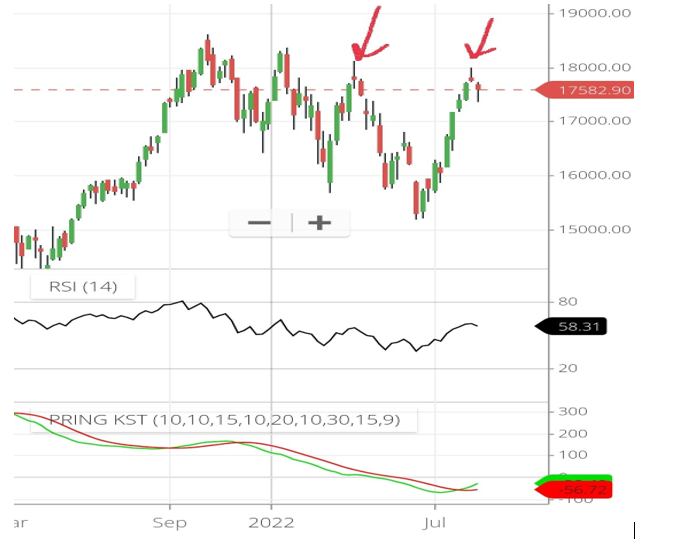
Anticipated - #Nifty Evening star Candlestick pattern on Weekly chart, will history repeat?

Another webinar on 26th August 2022 Friday at 4 when we warned about a crash which was much before Fed meet – check it out here

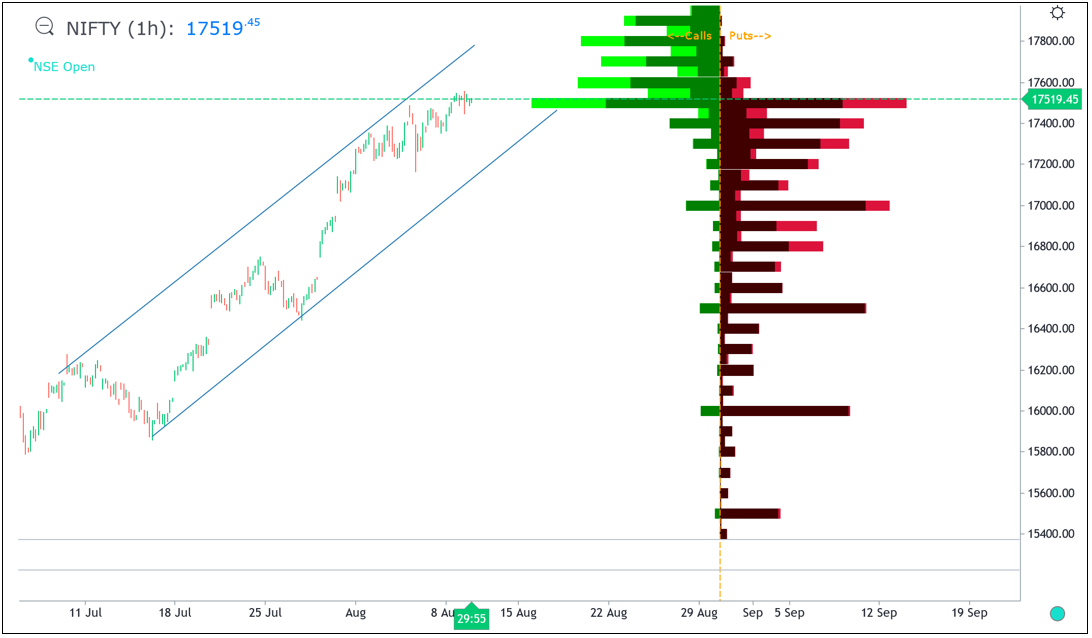
Below chart shows areas of warning and move so far


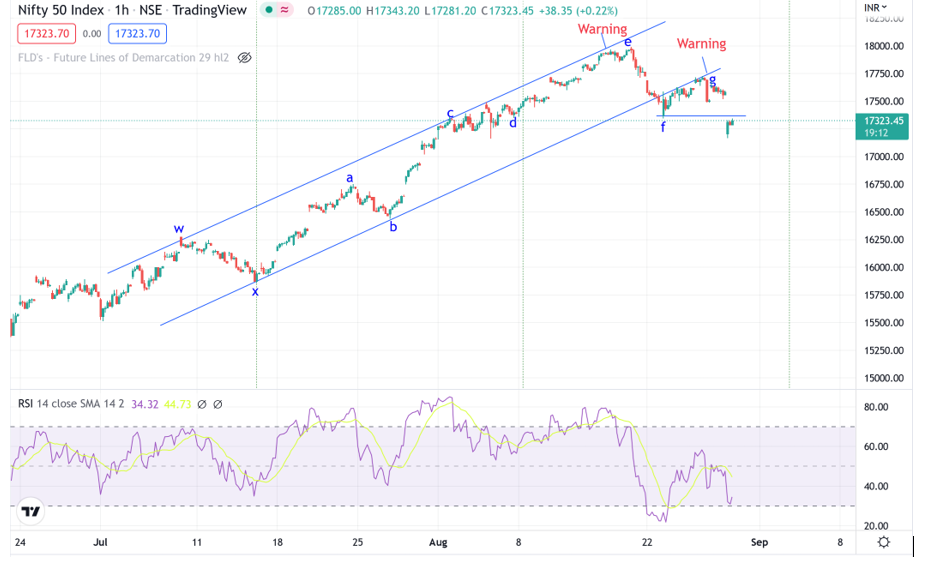
Nifty is moving precisely as per 55 Days Time cycle, Lunar cycle and Elliott wave pattern. It is important to have these tools to trade extremely well and stay ahead of the crowd. During major turns one has to take opposite stand to the majority and we did that again this time when Nifty was nearing that 18k levels.

From here, we expect the pullback to be shallow. On upside 17480 is important resistance level and sharp rise in Open Interest at 17500 is also suggesting crossing that by this expiry is not going to be easy. So, pullbacks can be used to sell calls as long as 17480 remains intact on closing basis.

Most Advanced Technical Analysis Training – Master of Waves scheduled on 17th – 18th September is going to cover Elliott Wave, Neo Wave and Hurst’s Time cycles which can empower you to catch not only major tops and bottoms but also every single turn even on Intraday basis. Trade with an Edge, Early Bird Ends on 31st August 2022.
Know More

Friday, August 26, 2022

Why Nifty Can Crash if 17340 Breaks?


Nifty forming Evening Star Candlestick pattern, If 17340 breaks we can see sharp decline. See Nifty path using Elliott wave, Gann sq of 9 by Stock Market Expert Ashish Kyal

- Learn complete Elliott wave, Neo wave along with Time Cycles and equip with excellent trade setups for trading Intraday and positional along with forecasting the markets from very hour, day and months. 2 Days of Live event on 17th – 18th September 2022, Know more here OR Contact us on +919920422202
-----------------------------------------------------------------------------------
We would love to connect with you on Social Media:


----------------------------
"SEBI “Research Analyst” No: INH000001097
Write to us on : helpdesk@wavesstrategy.com 
Contact us: +91 9920422202 

Thursday, August 25, 2022

Nifty Neo wave Diametric pattern, Why Crash if 17340 Broken?

 Neo wave is advanced Elliott wave concept which is GPS of the market. It gives maturity of trend, directional move possible and much more information a trader needs.

Diametric pattern is a 7 legged structure that has a typical behavior of contraction then expansion or vice versa. This is the most common pattern and can help traders take positions once the pattern is recognized early on.

Nifty hourly chart:


Nifty hourly chart shown above clearly shows the entire rise inform of Neo wave Diametric pattern from the lows of 15900 levels.

We have been able to catch the top at 18000 when everyone was super bullish and expected 2 to 3 days of fall. This was brilliant opportunity for Option traders to either buy puts or short calls to trade the reversal. Nifty in just two days declined from 17990 to below 17350 levels.

Neo wave clearly suggested that wave f should move on downside and also prices to move from upper trendline resistance.

Now near the lows of 17350 we had a positive Time cycle turning up on a 15 minutes time frame and so we alerted it is time for wave f completion and possible start of wave g higher. However, wave g trading is always tricky as this is the last leg within the Diametric pattern. Having said that we usually expect wave g to tend towards 61.8% to equality of wave a. But this is a guideline and not a necessity. So, now move above 17756 which is Gann sq of 9 level will extend the up move in form of wave g whereas break below 17340 might indicate a deeper fall and complete the entire rise.

Where many are looking at macro data or inflation and Crude oil for buying or selling markets we are simply looking at prices alone with Elliott wave lens to understand the areas of reversal and taking a trade setup as per wave patterns.

Fibonacci retracement gives target of 16250 which is 61.8% of the rise but only once we see sharp fall below 17340 levels followed by wave g completion.

In a nutshell, move above 17756 is required to extend wave g upside whereas breach below 17340 will be bearish for deeper correction. One can trade basis of these levels once the pattern completion is confirmed using two stage confirmation technique.

Thus one can know the levels when to turn bullish or bearish and trade prudently.

Master of Waves – Learn the science of Trading Using Elliott wave, Neo wave and Time cycles on 17th – 18th September 2022. Empower yourself using the method that very few are aware of which is simple step by step process for trend forecasting. As we always say, once and Elliottician always an Elliottician and there is a reason to that. See it yourself, Limited seats only, Early Bird Ends on 31st August 2022. Know more

Wednesday, August 24, 2022

Announcement - Why Elliott wave with Time is Must Tool for Successful Trading


Master of Waves (MOW) – Learn the science of Elliott Wave, Neo wave along with Time cycles in the upcoming program on Master of Waves and equip your trading skills using this simple and powerful forecasting tool. Along with this also learn the objective techniques of Timing the markets and Ichimoku Cloud. This will form a complete guide or trading system.  Know more here  or call 9920422202

We would love to connect with you on Social Media: 


----------------------------
"SEBI “Research Analyst” No: INH000001097
Write to us on : helpdesk@wavesstrategy.com 
Contact us: +91 9920422202 


Tuesday, August 23, 2022

5 Rules for Elliott Wave Trading


Master of Waves (MOW) – Learn the science of Elliott Wave, Neo wave along with Time cycles in the upcoming program on Master of Waves and equip your trading skills using this simple and powerful forecasting tool. Along with this also learn the objective techniques of Timing the markets and Ichimoku Cloud. This will form a complete guide or trading system.  Know more here  or call 9920422202

We would love to connect with you on Social Media: 


----------------------------
"SEBI “Research Analyst” No: INH000001097
Write to us on : helpdesk@wavesstrategy.com 
Contact us: +91 9920422202 


Monday, August 22, 2022

Nifty - 2 Powerful Indicators, You Cannot Miss!

 Nifty has shown a fall of more than 460 points since 19th August 2022 and was able to capture most of it.

We published Nifty analysis in "The Financial Waves Short Term Update" Check out below the detailed research report that we published.

Nifty Daily chart (22nd August 2022):

Nifty 60 mins chart (22nd August 2022):

Wave analysis as we published on 22nd August 2022

On the weekly chart, Gravestone Doji has formed. The prior top was formed in a similar fashion. However, if prices manage to give close below previous week’s low then it will be a sign of weakness.

On the daily chart, for the first-time prices have closed below prior day’s low. In the previous session, outside candle has formed which suggest that trend is still bullish as long as we do not see a close below Friday’s day low. Prices have also taken exact support of channel. However, break of this support can suggest that further correction can be seen.

On the hourly chart, as per OI data aggressive call writing was seen at 17900 and 18000 strikes. It Is soon to conclude anything. Today is going to be an important day as it will confirm further trend. If prices close below 17690 then further correction can be seen in form of wave f.

In a nutshell, any break below 17690 can drag the price lower towards 17550 (which is an important support level. Whereas, for the upside 18000 can act as a major hurdle.

BANG ON!

Happened: Earlier in the report, we had mentioned that, any move below 17690 can further drag the price lower towards 17550. In today’s session Nifty had a gap down opening and have shred more than 160 points. Further, Nifty made a low of 17525 levels!

Subscribe to Equity calls and get a free daily equity research report “The Financial Waves Short Term Update” that provides a clear strategy using Elliott Wave and indicators on Nifty, Bank Nifty, and stocks. Get access over here

Master of Waves (MOW) – Learn complete Elliott wave, Neo wave along with Time Cycles and equip with excellent trade setups for trading Intraday and positional along with forecasting the markets from very hour, day and months. 2 Days of Live event on 17th – 18th September 2022, Know more here

Friday, August 19, 2022

Nifty Trading using Ichimoku cloud and #neowave on 15 Mins


OTTA program – Options Trading Using Technical analysis focuses on Candlesticks, Volume profile, Options Trading, Trade setup using Bollinger Bands and much more. Be a part of this Elite group of Option Traders. Know here - https://www.wavesstrategy.com/ottaoffer or call 9920422202

We would love to connect with you on Social Media: 


----------------------------
"SEBI “Research Analyst” No: INH000001097
Write to us on : helpdesk@wavesstrategy.com 
Contact us: +91 9920422202 

Thursday, August 18, 2022

Nifty Ichimoku Cloud with Neo wave on 15 minutes

 Nifty approaching 18k and has been on a tear on upside with no pullback or correction that majority have been waiting for.

During strong trends, the simple powerful indicator can be Ichimoku Cloud which can be combined along with Neo wave pattern for prudent entry and to catch reversal.

Nifty Neo wave 15 minutes chart:

Nifty has been moving up in form of Gaps. We can see that after Gap up opening prices are simply consolidating for rest of the day. So in order to make use of this trend one has to look for pullbacks towards the cloud support and then enter keeping stoploss of prior wave low.

Neo wave pattern – The entire rise looks to be in form of Diametric pattern. Prices are currently in wave g of the pattern. As per Neo wave we will get negative confirmation once there is two stage confirmation. As per this we need to see faster retracement below the last rising segment.

In the above case wave g started from 17790 levels and so break below this level in faster time will indicate that the short term consolidation or correction of this up move can start. Ichimoku Cloud support is also placed near 17800 levels.

Thus by combining Neo wave with Ichimoku cloud one can combine the power of Forecasting tool along with strong trend following method.

This is especially crucial for Option traders who are looking forward to catch a reversal with small risk and good rewards.

In a nutshell, Nifty immediate support is near 17790 levels with 18k as the hurdle. Move above 18k will continue the uptrend towards 18293 which is also Gann level and wave g equality of wave a.

Become Market Wizard – Be a part of BMW program and learn to trade Options using Technical Analysis (OTTA), Ichimoku Cloud, Volume profile with clear trade setup, add the power of forecasting with Neo wave for Intraday to positional and swing trading. OTTA Live event starts on 20th – 21st August and Master of Waves (MOW) is scheduled on 17th – 18th September – Check here for more details.

Wednesday, August 17, 2022

Why Option Trading using Technical Analysis (OTTA)


OTTA program – Options Trading Using Technical analysis focuses on Candlesticks, Volume profile, Options Trading, Trade setup using Bollinger Bands and much more. Be a part of this Elite group of Option Traders. Know here - https://www.wavesstrategy.com/ottaoffer or call 9920422202

We would love to connect with you on Social Media: 


----------------------------
"SEBI “Research Analyst” No: INH000001097
Write to us on : helpdesk@wavesstrategy.com 
Contact us: +91 9920422202 

Thursday, August 11, 2022

Nifty Trading Strategy 11-08-2022


#Nifty sharp reduction in 17500 call OI and shifted to 17700 calls, however in this uptrend most of time the call sellers have been trapped. Nifty came close to this level of 17756 so expecting sideways action from here with Gap support 17550.

Learn the science of Trading Options by seeing Big players activity using Volume profile, OI profile, Option multibagger strategy in Options Trading (OTTA) on 20th - 21st Aug 2022 and forecast using Elliott wave, Neo wave, Time cycles in Master of Waves (MOW) on 17th - 18th September. Combined together we call in Become Market Wizard (BMW), Register here - https://www.wavesstrategy.com/bmw

#AKTradingGurukul

Wednesday, August 10, 2022

Sourav Ganguly recommending Ashish Kyal Trading Gurukul


A Special Give away From Ashish Kyal Trading Gurukul

Download the App (Ashish Kyal Trading Gurukul) on Android now and Access Free Exclusive Bonus Videos on Stock Market to enhance your learning. 


Download "My Institute" App and enter org code: esiad

Don't Miss Out! Check the Study material section with videos to see on the App. 


Expiry Day Trade - Nifty Option Strategy for 11th August 2022

 #Options are powerful instruments to trade if one can understand the overall direction of the market using simple techniques of Candlesticks and Open Interest analysis.

Below chart of Nifty shows OI profile from the Gocharting platform. (Use the code AK20 for offers)

Nifty 60 minutes chart:

Open Interest analysis:

#Nifty open interest profile is showing sharp rise in Calls and Put OI at 17500 levels. This indicates short straddle is into play as of now. So expecting market to expire tomorrow within a range of 17680 - 17340 as per this. As the combined premium of short straddle will result into this range.

Basis of above and looking at the overall market direction for now it is better to trade in direction of big players who are creating above positions. However, to safe guard rather than shorting straddle which is selling both calls and puts of same strike, we can short strangle that is selling OTM calls and put Options.

Nifty 11th August expiry, 17050 Put quoting near 6.20 and Nifty 17800 Calls quoting near 6.20 as of 11.45am on 10th August 2022. Combined premium inflow will be 12.40 and keeping a risk to reward as 1:1 combined stop of 24 can be placed in the system. This means that one can either gain approx. 12 or lose 12.

Given the sideways nature and OI build up there is high possibility that Nifty will not cross either 17800 – 17050 levels by 11th August 2022.

Along with this it is important to also apply opening hour candlestick strategy and Time cycles for higher conviction trades.

By combining Candlestick, Open Interest Profile, Opening hour strategy and Time cycles one can form amazing Option trades for intraday or positional basis.

Become Market Wizard – Learn the science of Trading Options using above methods and add the flavor of Elliott wave, Neo wave and Time cycles in Option Trading Using technical analysis (OTTA) – 20th -21st August 2022 and Master of Waves (MOW) 17th – 18th September 2022. Early BIRD Ends Today. Limited seats only. Register here to generate passive source of income using Options the way it works. Register now

Friday, August 5, 2022

Nifty Why below 17160 it can Crash, Move above 17517 must


Option Trading along with Elliott wave is the best combination for Trade Setups, be a part of upcoming Become Market Wizard BMW program and trade with an edge like never before, know more here - https://www.wavesstrategy.com/bmw OR Contact us on +919920422202

We would love to connect with you on Social Media: 


----------------------------
"SEBI “Research Analyst” No: INH000001097
Write to us on : helpdesk@wavesstrategy.com 
Contact us: +91 9920422202