Friday, November 26, 2021
Options Trading Using Elliott Wave & Ichimoku Cloud For Coming Week
Thursday, November 25, 2021
Bank Nifty Elliott Wave Diametric, Bollinger Bands® Open Interest Targets
Bank Nifty is following Advanced Elliott wave – Neo wave pattern amazingly well and when this is combined with Bollinger Bands, Channels and Candlestick it is possible to forecast with high accuracy.
Elliott wave becomes very useful during major reversals and gives us high conviction trade setups. See the below research which clearly highlights this fact.
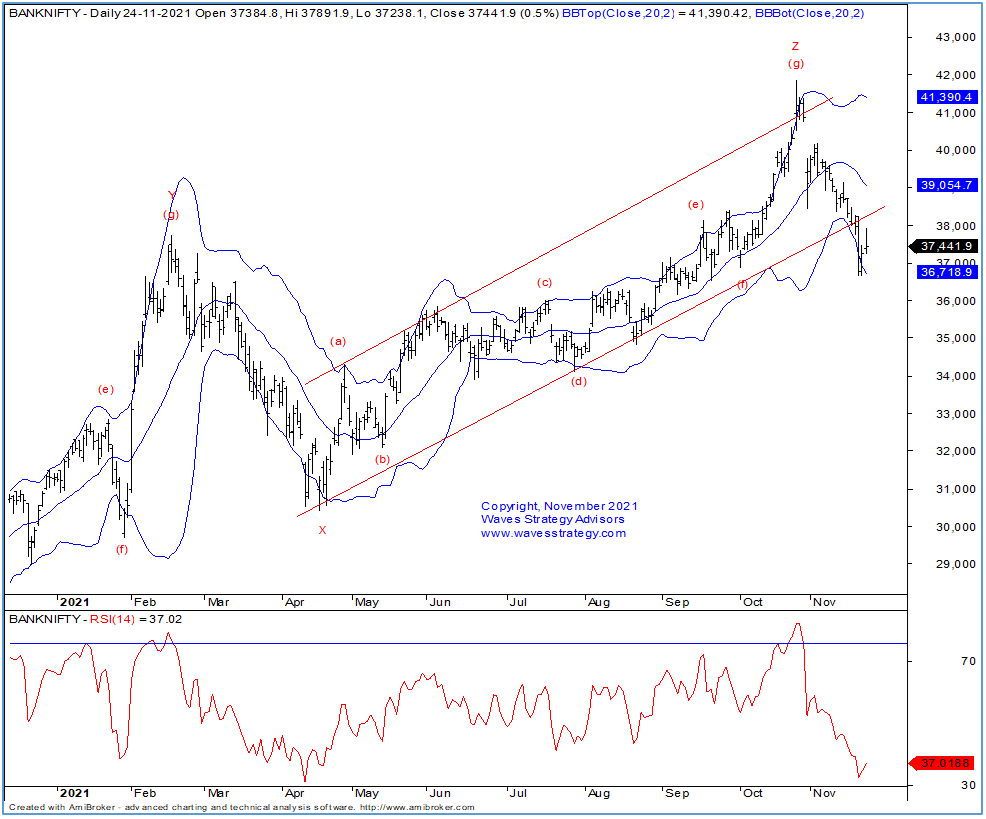
Bank Nifty daily chart:

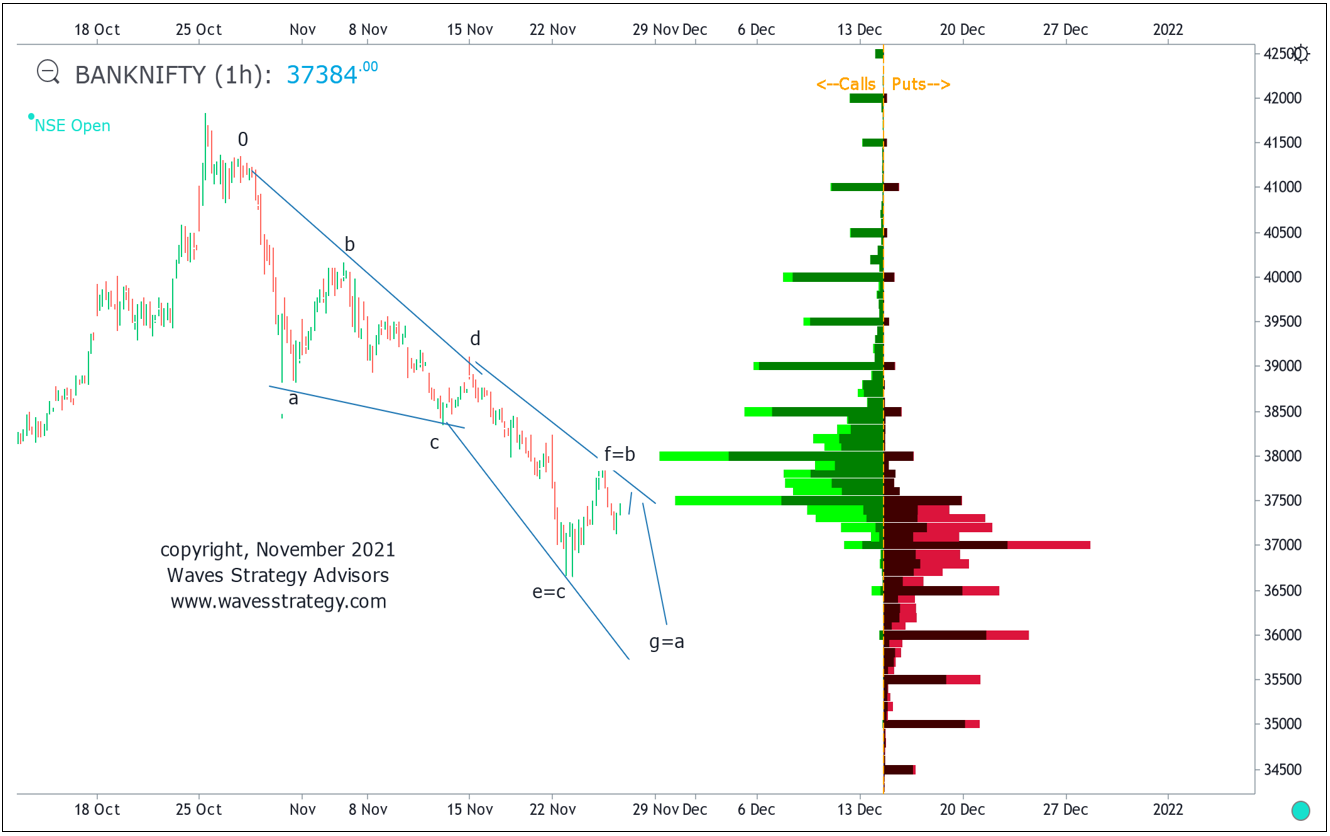
Bank Nifty hourly chart with Open Interest Profile

Elliott wave analysis:
On the daily chart, we can see that after completing minor wave g near 41800 level sharp fall has been witnessed which suggests that intermediate wave Z might have completed. Prices have made an attempt to bounce from the support of lower Bollinger band however till we do not see close above middle bands, we can expect weakness to persist. Looking at the break of upward rising channel support, there is high likely that trend can remain in sell on rise mode.
Bank Nifty Hourly chart Diametric pattern with Open Interest profile – Bank Nifty has been forming precise Diametric pattern which is a 7 legged correction. This pattern is described in Neo wave with all legs corrective in nature. Forecasting can be done as per following relationship between each of the legs as follows:
Wave g = wave a
Wave f = wave b
Wave e = wave c
The above is a guideline and helps a trader to trade accordingly. We are combining Open Interest profile as well along with it for high conviction trade setups
Open interest profile: suggests that there is highest call open interest at 38000 levels and highest change in Call OI is at 37500 and so crossing this zone can be challenging, whereas on the downside 37000 has highest Put OI and also the change. It seems that for bears to take back control we have to see decisive break below 37000 levels and for the up move break above 38k is must. Now that we have these crucial OI data and Elliott wave pattern it seems that there can be a minor pullback but not necessary post which Bank Nifty can start moving lower again towards 36400 – 36000 levels which is target as per Diametric pattern and also minor OI support.
In a nutshell, above research clearly shows that by knowing about Elliott wave, Neo wave patterns and combining OI data one can form excellent trading strategy either in Options or Futures. Many are focussing only on Options without knowing the market outlook which will not yield into any profitable outcome. It is therefore important for traders to focus on understanding these simple and easy techniques and then form Option strategies.
Most Advanced Training on Technical Analysis - Learn to Trade Options with step by step trade setups along with breakout strategy, Option Buying strategy, Volume and Open Interest profiling for Intraday, Swing trading, Also options can help to generate passive income if one understands the risk and accordingly take profitable positions. Become Market Wizard – BMW will combine Option Trading Using Technical Analysis (OTTA) on 11th – 12th December and Master of Waves (MOW) on 15th – 16th January. Trust me this will change you trade options and forecast the markets. Early Bird Ends on 30th November, know more here
Tuesday, November 23, 2021
NIfty crashed! Is It the Start of a Big Trend on 23-11-2021
Thursday, November 18, 2021
Nifty Intraday Trade Strategy using Ichimoku Cloud
Wednesday, November 17, 2021
Bitcoin – Is it Time to Buy? Time Cycle 58 Days
Crypto currency has been in news given the sharp rise in many of the crypto coins. Are you riding the trend?
A simple way to enter into Crypto currency like Bitcoin is to identify the days when the prices can reverse from down to up. Time tools are simple and effective way to time the trades or investments.
Let us see when will be time in favour to invest in Bitcoin.
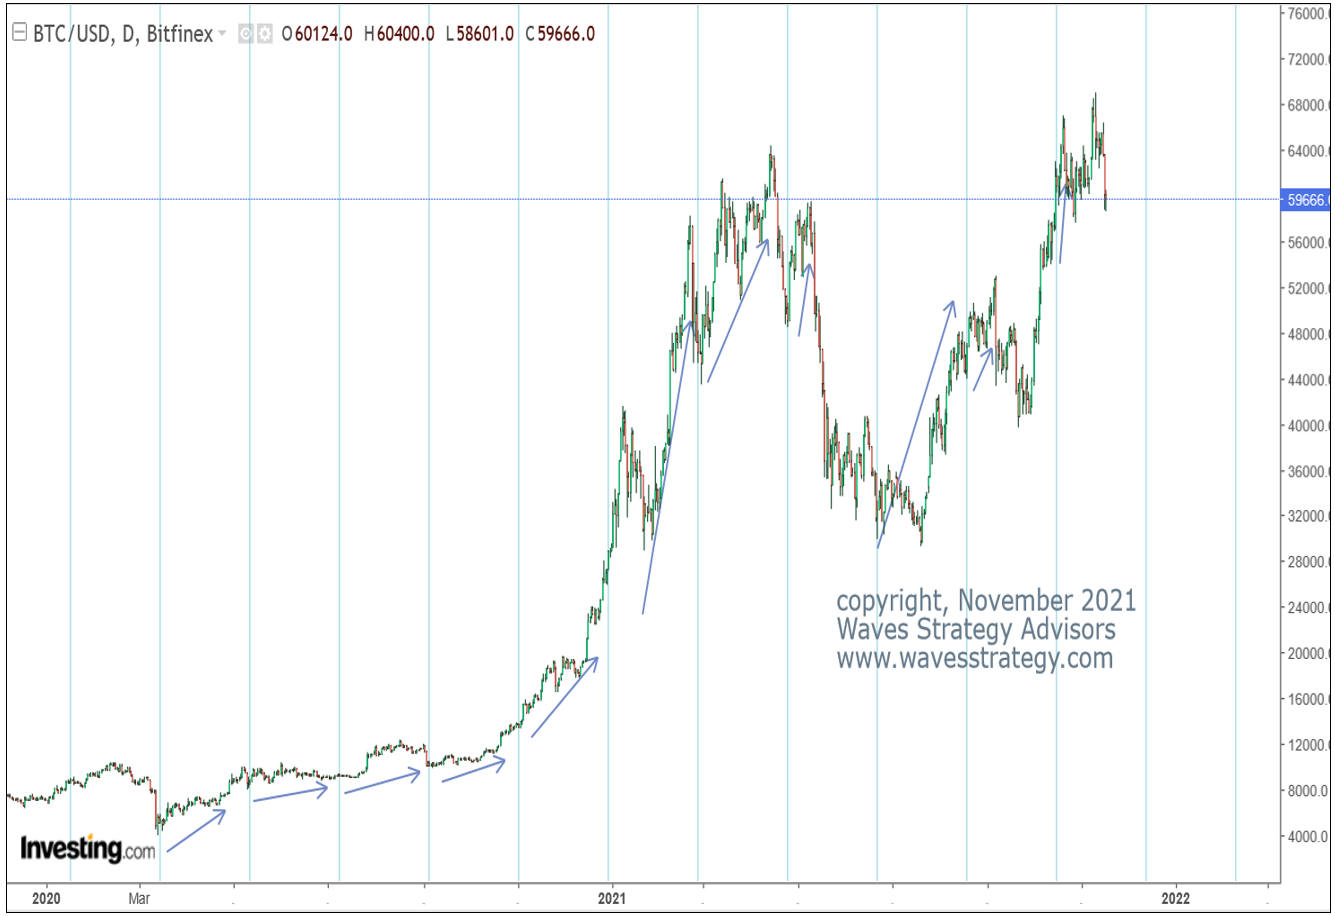
Bitcoin Daily chart – 58 Days Time Cycle

Time Cycle analysis:
J. M. Hurst known as the father of cycles have done a lot of scientific work not only in space of physics but also in the application of Cycles on stock market. He identified a set of nominal cycles that is working across the scientific field and can be extended to the cyclicality of freely traded assets as well. We will not dwell into the theory as of now.
We have applied 58 days Time Cycle which is in close approximation to the Hurst’s Nominal cycle of 56 days on BTC/USD. The same looks to be working extremely well and we can see everytime prices formed a bottom on this cycle day on most of the occasions.
A few of the Time cycle helped prices to more than double in just a few weeks of time. This is the power of understanding when Time is in favour for investment or trading.
Next low as per Time Cycle on Bitcoin is near 12th December 2021. This clearly suggest that time will favour post 12th December. It is also possible to forecast price by using Time and it is an innovation by Hurst in field of Technical analysis.
So, now that the time will be in favour post 12th December it is possible to form a strategy accordingly for trading this crypto currency.
3 Months of Mentorship on Timing the Markets starts in 4 days – Mentorship starts from 20th November and it will focus on trade setups, time tools, Option strategy, Risk management, Stock selection methods, Multibagger portfolio creation and lot more. Are you part of this Elite group we calling as #TimeTraders? For more details Contact on +919920422202
Tuesday, November 16, 2021
Why Timing the Market is in focus for Upcoming Mentorship?
Timing the Market is the Key to trading success which can be achieved only when Price and Time are in sync. see in this video why Timing the Market is in focus for Upcoming Mentorship...If you want to be a part of this exclusive group simply register here - https://www.wavesstrategy.com/mentorship OR Contact us on +919920422202
We would love to connect with you on Social Media: Twitter - https://twitter.com/kyalashish/ Instagram - https://www.instagram.com/kyalashish/ Facebook - https://www.facebook.com/AKTradingGurukul Telegram - https://t.me/AKTradingGurukul LinkedIn - https://www.linkedin.com/in/ashishkyal/ ---------------------------- "SEBI “Research Analyst” No: INH000001097 Visit us : https://www.wavesstrategy.com/ Write to us on : helpdesk@wavesstrategy.com Contact us: +91 9920422202

