Showing posts with label Techical Analysis. Show all posts

Monday, June 19, 2023

NIFTY: Path Ahead for Coming Weeks using Elliott Wave and Channel

 Nifty “closed” at lifetime high levels on 16th June 2023 at 18826. It just missed crossing above the 18887 which is previous high levels touched on 1st December 2022.

Let us look at the overall Elliott wave perspective to understand the maturity of trend and if more steam is left over coming days.

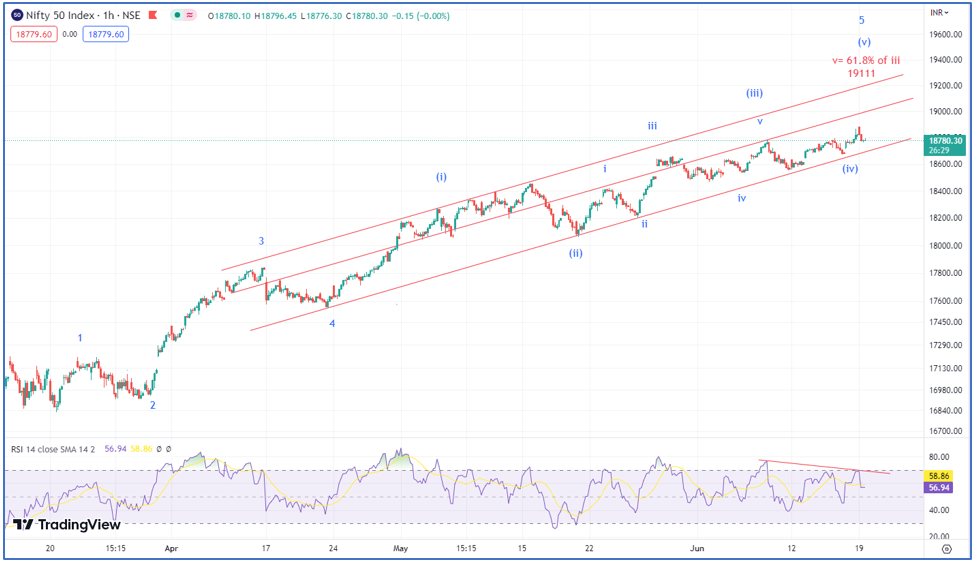
Nifty hourly chart – 
Elliott Wave analysis:

Nifty path ahead – As shown in Nifty hourly chart, rise from the lows of 16828 is in impulse pattern that consists of 5 waves. There is extension in wave 5. Prices are also moving in red channel and currently wave (v) of 5 ongoing. As per this Nifty can hit lifetime highs above 18887 levels and eventually move to the levels of 19111. This is where wave v is 61.8% of wave (iii).

Wave personality suggests that wave (v) is usually associated with slower momentum and we can see the same on the above chart where RSI is making lower highs with prices making higher highs.

It is prudent to avoid catching a top unless we see close below prior week’s low which is near 18530 over short term. For nearly 12 weeks there is not a single close below prior weekly low on index and so it is still buy on dips. Many are trying to catch a top here as the momentum is slower but do remember that prices can continue to rise with slower momentum unless price action confirms. 

Master of Cycles – Learn the science of Trading Time in simple step by step process. Hurst’s Time cycle technique combined with KST, Gann square of 9. This course is for everyone looking forward to increase their accuracy by timing the market and trade profitably using the scientific approach to trading. Online live event on 24th – 25th June 2023, Only a few seats left. 

Thursday, August 30, 2018

Tata Motors – How far will it fall? Is it a value buy?

Tata Motors had been a major underperformer within the auto space. With each swing of fall investors have been thinking this is it but only to see it fall further! So, even if you think it is a value buy at every fall you are only losing your capital.
It is therefore best to await and get positive price confirmation before committing your hard earned capital to a stock like this. A similar story was witnessed even in pharma stocks when at each fall everyone simply kept on losing money. However, we published our bullish outlook on Pharma only recently after seeing faster retracement above the last falling segment and when the important resistance levels were taken out. This makes a lot of sense as you are getting a value stock but with a strong technical confirmation.
Similar strategy should be adopted even for Tata Motors, Now look at the below chart which is published in our daily equity research report – The Financial waves short term update
Tata Motors Daily chart:

Tata Motors Hourly chart:


Wave analysis:
Tata Motors a leading global automobile manufacturing company has shown a massive downfall by 33% since the start of the year 2018. From the high made near 450 levels the stock has failed to show any signs of positive retracement and currently the stock is trading near its 52 week low.
As shown on daily chart, prices are moving in downward sloping channel. Prices are moving in the form of Complex correction pattern and the last set of correction in the form of wave z is ongoing. If carefully look at the RSI indicator we can see that it is moving in a range also the overbought zone for RSI has now changed to 60 from where prices recently witnessed a down move.
A shown on hourly chart, prices are forming Bow- Tie Diametric pattern in which contraction is seen in initial legs and currently expansion is ongoing.  As per wave prospective, wave ……….. is completed on upside near …… levels and currently wave ………. is ongoing on downside.
In short, trend for Tata Motor remains negative. Break below …….. levels can take the prices southward towards …….. levels or lower levels. Avoid creating any long positions unless we see close above ………. where wave ……… completed. This stock has drastically failed to live up to investor’s expectations and it is best to avoid catching a low here.
The above clearly shows the strategy you can follow to invest in so called value buying. It is best to let stocks run its course and when it is done we will know by seeing a faster retracement above the last falling segment.
So what are the key levels on stocks like Tata Motors for value buying?
Get access to The Financial Waves short term update and Multibagger research report to have a complete list of stocks that looks good right from short term trading to long term investments. Know more here

Wednesday, December 20, 2017

How to trade Copper precisely? Amazing application of Elliott wave!

MCX Copper had been moving precisely as expected and following Elliott wave along very well.
In below research you can clearly see how we have been able to capture the entire up move early on and the trend continued higher from the lows of 430 and now near 451 levels.

Below chart was shown in our commodity report – The Commodity waves short term update.

MCX Copper 60 mins Feb chart (shown on 14th December)

Happened:

MCX Copper 60 mins Feb chart:

Waves Analysis:

On 13th December morning we mentioned the following – In short, Copper is building momentum on upside. Use any dips towards 430 levels as buying opportunity for a move towards 440 or higher levels can be expected.

On 14th December morning we mentioned the following – Over short term, as shown on hourly chart, Copper has broken out of the downward sloping channel and can now move towards 445 mark. The overall bias will be positive and any dips should be used as buying opportunity. In short, Copper trend remains positive as long as 430 is protected on downside. Move above 439 can take prices towards 445 levels which is 61.8% retracement of the entire fall.

On 19th December morning we mentioned the following – prices are now near the upper end of the black channel and so buy on dips is ideal strategy in this commodity. Move towards 445 – 446 can be used as buying opportunity as long as 440 is intact. In short, Copper trend is positive as of now. Move towards 445 should be used to create long positions with strong support near 440 on downside.

On 20th December morning we mentioned the following – Copper is positive as long as 444 is protected. Move below this level will result into sideways action. We can now expect a move towards 453 on upside. BANG ON!

Happened: Copper is currently trading at the highs of 451 on MCX and we have been bullish all the way up from 430 levels in just few days of time.

The above research highlights the power of Elliott wave applied on base metals like Copper. Subscribe now to “The Commodity waves short term update” and see how to trade Gold, Silver, Crude and Copper. You can also opt for receiving Commodity Tips for calls directly on your mobile or whatsapp. Subscribe NOW