Showing posts with label KST. Show all posts

Friday, July 14, 2023

Nifty Options Trade Setup Volume, KST indicator, Bollinger Bands®

Volume profile along with KST Indicator and Bollinger Bands is classic technical analysis tools that help us to understand activity behind the scenes for Trading Options.

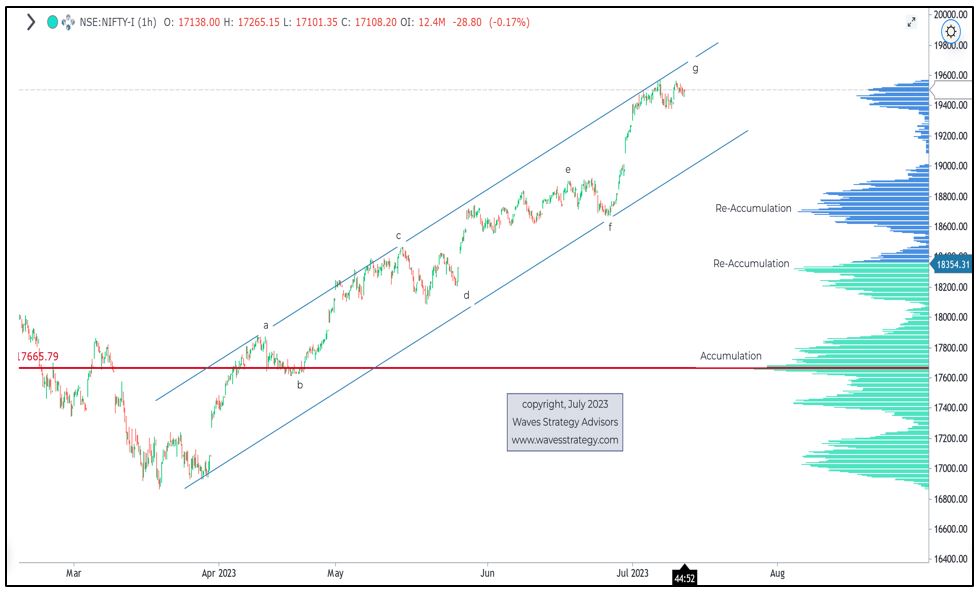
Below is the research as per Volume profile on Nifty which is moving in wave g as per Neo wave.

Nifty hourly chart – Volume profile.
Nifty 19000 Call Option hourly chart:

As can be seen on 1st chart Nifty is moving in form of wave g of Diametric pattern. Volume profile is different than normal volumes that most of the traders look at. In volume profile one can see big players activity and area where they are accumulating or distributing the stock. As we can see here there was major accumulation near the level of 17650 on Nifty followed by re-accumulation near 18350 and then again at 18700.

These levels act as important support now as big players will try to defend it. So as long as 18700 is intact medium term trend is intact on upside.

Options Trading using KST and Bollinger Bands – This is one of the most powerful way of trading to gauge if momentum is increasing and it is time to Buy options. For Options trader momentum and time are two most important thing.

KST indicator is a Time indicator and is derived using summation of multiple ROC.  We can see on the chart of 19000 call options that KST indicator has been dropping much earlier even before the prices turned sideways. This gave early warning that momentum is reducing.

Bollinger Bands – If KST line (green) is moving below the signal line (red) it suggest that prices can go sideways and so Bollinger Bands can be used to provide support and resistance and breakout levels. During such instance buy near support of lower bands and sell near hurdle of upper bands is the best strategy.

In a nutshell, Volume profile provides important support from medium term perspective to see possible price action areas and Elliott wave acts as GPS of the market. Then extending the concept of momentum trading with Bollinger Bands directly on options chart can give classic trading opportunity for Options buyers even for Intraday trading.

Mentorship on Elliott wave, Neo wave along with Time cycles – Learn the complete science of trading over period of 3 months along with live trading using above techniques. No prior knowledge required, no software required as there will be complete handholding for every single mentee. Mentorship session starts 27th July 2023. Act now before we go full and stop registrations as there are limited seats only. 


Thursday, June 15, 2023

Nifty Neo wave, 55 Days Time Cycle with Momentum Indicator


Elliott wave and Neo wave are forecasting technical analysis method that helps to understand the maturity of trend. This when combined with Time cycles can help to time the trade accurately.

Below chart of Nifty is showing Time indicator – KST along with Neo wave counts and why we are matured stages of up move?

Nifty daily chart:

Nifty when broke above 17060 we turned super bullish as prices were completing wave (b) and starting wave (c) on upside. We published the research in our daily equity research report The Financial Wavesshort term update

Now the markets have rallied nearly 1800 points from there and the momentum is reducing.

KST indicator – this is a time indicator as it takes summation of various Rate of change and is plotted as single indicator. KST also known as Know Sure Thing is developed by Martin Pring. This along with Time cycle application provides much needed clarity to time the market.

Neo wave – The internal counts of wave (c) is suggesting that prices are moving up in form of Diametric pattern which is a 7 legged pattern. Currently prices are in wave f formation which can be sideways to little pressure on downside. Post its completion wave g on upside can resume. So the trend is matured but we might still be in buy on dips mode for another week or so.

55 Days Time cycle – We can see that prices tend to form low and reverses back up from the middle line which is 55 days days cycle. The low may not be a major low but it can also be a minor down move and upside reversal. The latest black middle line also acted as reversal day where wave b got completed and prices started moving higher in wave c. Next cycle low is going to be on 6th July 2023.

In a nutshell, Nifty can drift higher with lack of momentum. Short term correction is possible but one more leg on upside in form of wave g can start taking prices to Gann levels of 18838 or near lifetime highs. But combine this with short term charts and trade accordingly.

Thus by combining Neo wave, Time cycle and indicator like KST one can form prudent strategy for trading stocks or even futures and options. This technique can be applied on daily, hourly and even 15 minutes time frame for Intraday trading.

Master of CyclesLearn the science of Trading Time in simple step by step process. Hurst’s Time cycle technique combined with KST, Gann square of 9. This course is for everyone looking forward to increase their accuracy by timing the market and trade profitably using the scientific approach to trading. Online live event on 24th – 25th June 2023, Only a few seats left.