Thursday, April 27, 2023

Nifty Elliott Wave, Is it 3rd Impulse Wave? Pattern Targets?

 Nifty Elliott Wave, Is it 3rd Impulse Wave? Pattern Targets?


Elliott wave or Neo wave is GPS of the market and provides the probable path prices can follow for Traders.

Impulse pattern moves in steps of 5 waves before we see reversal of the higher degree trend.

We were able to catch reversal near 17060 just when the upside trend was starting and also mentioned in our daily research report.

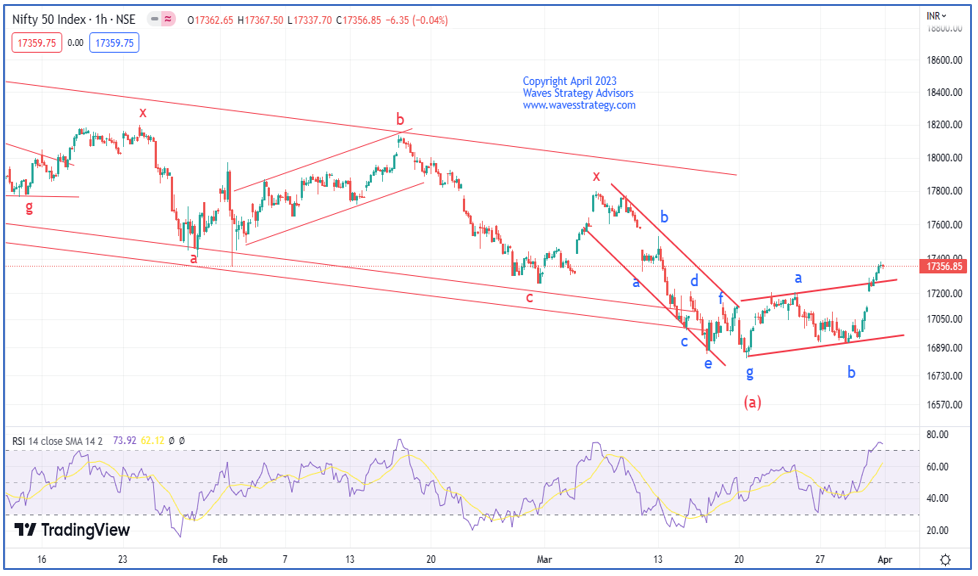
Nifty hourly chart shown on 29th March in daily research report – The Financial Waves short term update

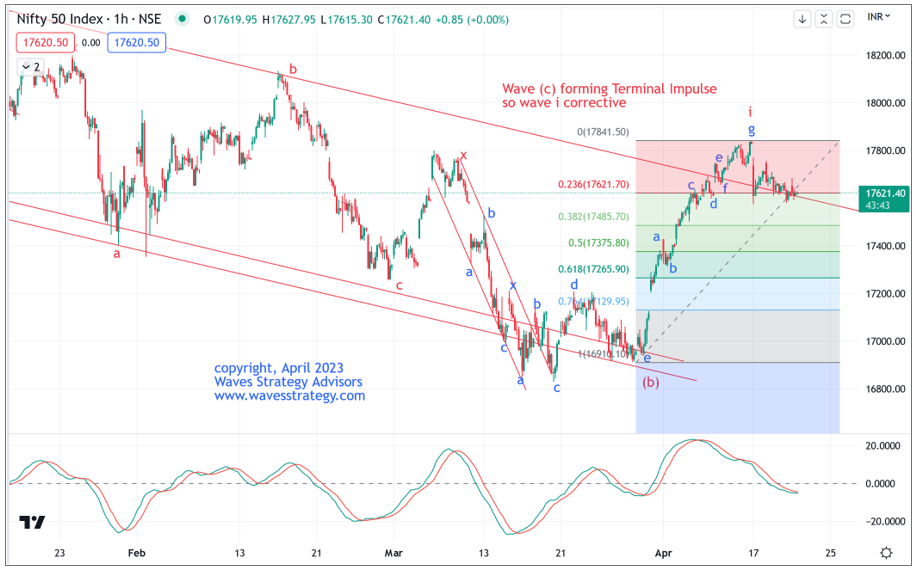
Below is chart of Nifty hourly showing prices are forming Ending Diagonal or Terminal Impulse pattern.

Nifty hourly chart - Happened

Elliott wave analysis

Anticipated - We were able to catch the low near 17060 levels just when the up move was starting and mentioned it in our previous research as well. Here is the link of research when we mentioned about breakout near 17060 levels – Nifty breakout Are you ready?

Happened - As shown in above chart post completion of wave (b) prices are moving up in form of wave (c). This wave (c) is impulse pattern but given that internal structure of wave i is corrective there is high possibility we are forming Terminal impulse pattern.

Terminal impulse is variation to the impulse pattern where each of the 5 legs are corrective pattern. The internal structure of wave i is Diametric.

Targets for Wave iii targets taking 0.618 * wave i is at 18100 levels. We will keep close track of ongoing pattern and will keep updating in daily research report. This is valid as per the rules as long as wave ii low near 17550 is intact. Break below this level will indicate bearish possibility but it looks less probably.

In a nutshell, above charts simply shows how by knowing Elliott wave or Neo wave pattern one can trade effectively as a complete trading system. Neo wave is advanced part of Elliott wave with more rules and better objectivity.

Subscribe to daily equity research reports with application of Neo wave on Nifty, Bank Nifty, 3 stocks on daily basis and complete strategy as per Elliott waves. Subscribe annually and get free monthly research reports – subscribe over here

Master of Waves Learn to Trade Options using Elliott wave, Neo wave, Hurst’s Time Cycles and Gann square of 9 scheduled on 6th – 7th May 2023. A complete trading system with step by step approach of wave theory. No prior knowledge required, No software required, it does not matter whether you are a Student, Housewife, or Trader looking to time the market and increase accuracy in Trading. 

Wednesday, April 26, 2023

Gold - Neo wave and 51 Days’ Time cycle

 Gold - Neo wave and 51 Days’ Time cycle


Gold is following its own independent Elliott wave pattern and Time Cycle. In the below chart we have shown the Gold movement along with the Neo wave and 51 Days’ Time cycle.

Gold Weekly chart

Gold Daily chart

Gold made lifetime high at start of the April month. After trading near all-time highs, we are witnessing some profit booking in the commodity. The primary reasons for the rally in the Gold also includes softening of dollar index. As, Dollar Index has fallen to a 2-month low, and the hope of the Federal Reserve to pause in an interest rate which could add fuel to the rally. The Fed has increased interest rates nine times in the last year. However, due to the increase in the interest rate, the possibility of an economic recession cannot be ruled out. Overall signs are suggesting that medium term outlook for this asset is likely to remain positive.

MCX Gold Neo wave perspective on weekly chart: As per wave perspective, in the mid of 2016 primary wave (4) completed and since then the entire rise that we are witnessing is in form of primary wave (5) In the first quarter of 2022, intermediate wave 4 of primary wave (5) finished its course, wherein minor wave ii has completed on the downside and the recent up move that we are witnessing is in form of wave iii.

On the Weekly chart, Gold is following the multiyear channel really well. Whenever prices reversed from channel support then an upside rally was seen. Recently, after reversing from the lower end of the channel now prices have shown a good steep rally. Also, ADX is trading near 30 suggesting that good momentum can continue which is acting as a confirmation.

On the Daily chart, our cycle of 51 Days is working out really well which was due on 21st April but still price confirmation is pending. Let’s take a look at Bollinger bands. Wherein mid bands are acting as a brilliant support and every time prices have reversed back from it. However, the medium-term trend for the metal is still on the upside as primary wave iii is unfolding on the upside which is considered as a strongest one. However, If Gold trades below 59600 then it may fall till 58500 on the lower side.  

In a nutshell, after a sharp rally, currently we are witnessing some profit booking and short-term correction towards 59600 is possible. However, trend for Gold is bullish and any dips should be used as a buying opportunity. Move above 61000 will confirm short term correction has completed and fresh buying can be seen which can lift price higher towards 62200 levels.

Master of Waves (MOW)  Learn the science of Trading with an Edge of Waves and Hurst’s Time cycles in an exclusive Live online training scheduled on 6th – 7th May 2023. Get Bonus videos of 6 hours on Elliott wave basics before the live event, Limited seats only. Act now and forecast markets like never before. 

Thursday, April 20, 2023

Nifty 55 Days’ Time Cycle with Neo wave – Is BIG Trend Starting UP?

 Nifty 55 Days’ Time Cycle with Neo wave – Is BIG Trend Starting UP?


Time cycle and Advanced Elliott wave – Neo wave acts as GPS of market and helps us to understand the overall maturity of trend.

On Nifty we are showing 55 days Time cycle zone that has helped to capture most of the lows and Elliott wave counts. Both Time and Prices are absolutely in sync!

Nifty daily chart:

Nifty hourly chart:

We have been bullish on Nifty as soon as 17060 levels were broken on upside and prices rallied by nearly 800 points from there.

Given the sharp rise and break above the channel there is possibility that wave (b) got completed at the lows and we are now in wave (c) of a Flat correction. As per Neo wave rules, in a Flat correction wave (b) should take more time than that of wave (a) and should also retrace more than 61.8% of wave (a).

The rise from the lows as shown on hourly chart is in form of corrective pattern and so wave (c) might be forming Terminal impulse pattern. Wave i looks to be complete and wave ii is under formation which has retraced 23.6% of wave i so far. Break below 17570 will open targets for 17485 which is 38.2% Fibonacci. Move above 17800 will start wave iii on upside.

In a nutshell, Nifty might have started bigger upside trend with the fall only a part of wave ii and post its completion wave iii might start higher. Upside targets can be derived once wave ii low is in place.

Major difference between Elliott wave and Neo wave is that – Neo wave has more stringent rules and patterns that helps trader to stay objective giving classic trade setup with prudent risk reward right from smallest time frame to long term forecast.

Master of Waves (MOW) – Learn the science of Trading with an Edge of Waves and Hurst’s Time cycles in an exclusive Live online training scheduled on 6th – 7th May 2023. Get Bonus videos of 6 hours on Elliott wave basics before the live event, Limited seats only, Early Bird Ends on 25th April 2023. Act now and forecast markets like never before. 

Wednesday, April 19, 2023

COALINDIA: How To Derive Targets using Elliott Wave and Price Action

 COALINDIA: How To Derive Targets using Elliott Wave and Price Action


Elliott wave helps us to understand the trend of the market. Coal India has continued to be showing strong up move over past few sessions. It has worked out well especially if you know how to apply Elliott wave along with technical indicator.

We published the following article on Coal India pre-market on 13th April 2023 in "The Financial Waves Short Term Update" which our subscribers receive pre-market every day.

Coal India Hourly chart as on 13th April 2023 (Anticipated):

Coal India Hourly chart as on 19th April 2023 (Happened):

Wave analysis as on 13th April 2023:

In the previous session, Coal India opened on a flat note. However, stock showed a good up move during the day. At the end of the day, prices settled with a gain of 1.81%. Also, prices are moving up by following higher high higher low fashion which keeps bias positive as long as we do not see a close below previous candle’s low. Along with this, KST has also turned above signal line. Now if it trades near zero line then further good momentum can be seen. As per wave perspective, wave b is moving on the upside.

On the hourly chart, we used Ichimoku cloud to gauge price direction. As we can see that, prices are trading above the cloud and also moving up by taking support of the base line(red). For now, any dip towards the base line can be used as a buying opportunity i.e. towards 224 levels. Currently, intermediate wave c is moving on the upside which opens possibility of a flat pattern.

In a nutshell, Coal India looks sideways to positive. Use dips as a buying opportunity for a move towards 234 as long as 220 holds on the downside.

Happened

We can see that wave counts have helped us to find out the trend reversal for Coal India well in advance. After completing wave b near 222 levels we had mentioned possibility of up move in form of wave c and the stock moved as we expected. After publishing the report, within three trading sessions stock has achieved our target. As we expected after a dip the stock has made the high of 234.6 levels.

Master of Waves (MOW) – Learn the science of Elliott wave, Neo wave along with Time cycles in upcoming Master of Waves on 6th – 7th May 2023. Forecast the market like never before and see huge difference in your trading career, Limited seats only, Early Bird Ends soon! 

Wednesday, April 5, 2023

Bank Nifty Bang On using Neo Wave and Ichimoku Cloud

 Bank Nifty Bang On using Neo Wave and Ichimoku Cloud

Banknifty and Nifty showed a very good rally over past few days but this was completely predictable. Elliott wave is a GPS of the market and we are applying it on Bank nifty as shown below.

We published the following research on 3rd April, 2023 (pre-market) in – The Financial Waves short term update.

Bank Nifty Daily Chart as on 3rd April 2023

Bank Nifty 60 mins chart as on 3rd April 2023

Wave analysis as on 3rd April 2023:

In the previous session, Bank Nifty opened with a gap up of more than 200 points. During the day also index showed an exceptionally well rally. At the end of the day, Bank Nifty settled with a gain of 1.75%. On the daily chart, we have used Bollinger Bands. Wherein, prices have given a close above mid band. Now with follow up buying we can see a good rise. Prices are looks to be retesting channel.

On the hourly chart, after a sharp rally now one can use dips towards the conversion line i.e. towards 40180 can be used as a buying opportunity. It looks like buy on dips would be a good strategy to ride the trend. Also, a movement was sharp so, RSI is trading near the overbought zone. In such scenarios, one should avoid catching tops and should use dips as a buying opportunity. As per wave perspective, wave (g) has completed on the downside in form of Diametric pattern and next leg is unfolding on the upside.

In short, Bank Nifty looks sideways to positive. Use dips as a buying opportunity for a move towards 41000 as long as 39900 holds on the downside.

Happened

Bank Nifty moved up as expected and achieved our Target of 41000. The overall trend still remains buy on dips.

This clearly shows that by combining price action and indicators one can easily identify wave patterns which can help to derive trend.

Options Trading with Elliott wave, Neo wave and Time cycles – Learn to trade Stocks & Options along with Open Interest profile, Volume profile, KST Time indicator, 5 clear Trade setups for Options buying in Options Masterclass scheduled on 15th and 16th April, combine this to other level of forecasting with Master of Waves (MOW) on 6th – 7th May 2023. Both this combined courses is called Become Market Wizard (BMW). Act now and learn to generate passive source of Income, Limited seats only - Know More.

Monday, April 3, 2023

Nifty Using Bollinger Bands, Elliott Wave Pattern

 Nifty Using Bollinger Bands, Elliott Wave Pattern


Nifty moved as expected today, was it predictable using a simple technical analysis study and advanced Elliott - Neo wave.

Check out this example of how we used Bollinger bands with wave counts to identify price movement. Below chart shows Nifty Neo wave count along with Bollinger Bands. This research is picked up from the daily Equity research report.“The Financial Waves short term update" which was published today before market opens

Nifty Daily Chart

Nifty 60 mins chart

In the previous session, Nifty opened with a huge gap up of 130 points. During the day, Index continued to show a good rally. At the end of the day, Nifty closed at 17359 with a gain of 1.63%.

Amongst the stocks, Reliance Industries closed with a gain of 4.31%. Along with this, Nestle, Infosys, ICICI Bank, Tata Motors, TCS were also the top gainers for the day. On the other hand, Apollo Hospital, Sunpharama, Adaniports, Asian Paints were the top losers list by the NSE.

All the sectors witnessed good buying. Wherein, IT, Auto, FMCG, Energy, Realty sector gained the most and closed on a positive note with a good gain of 2.45%, 1.01%, 1.06%, 1.97%, 1.63% respectively. Broader Indices showed good buying for the second consecutive day and closed on a positive note. India VIX closed with a huge loss of -5.14% at 12.93

On the weekly chart, we can see that prices have exactly bounced back from important support of 16800. Also, this week’s candle has closed above previous candle’s high which indicated pause in a downtrend.

In the previous session, Nifty witnessed a good rally and as a result formed a big bullish candle. We have also used Bollinger Bands. Wherein, prices have close above mid bands and looks ready for a move towards the upper bands. However, follow up action is required to confirm the same. On the daily chart, wave b is still ongoing on the downside so post this rise we might start seeing a downward correction as our 55 Days cycle is due on 18th April.

On the hourly chart, we can clearly see breakout of the classic double bottom formation which happened in the Friday’s session. After a breakout Nifty witnessed a good rally. We have predicted few days back about fib retracement of 61.8% of entire wave (a) which comes to 17420. So now, we can expect a pause near this level. Currently we are in wave c of (b) which opens possibility of a flat pattern.

In a nutshell, short term view for Nifty looks positive. For now, use buy on dips method to ride the trend with the targets of 17420 or higher as long as 17180 remains intact on the downside. Any move below which will be a first sight of concern.

Happened:

Nifty has been moving precisely as per Neo wave count. Nifty followed buy on dips method as we mentioned and achieved our Target of 17420 and made high of 17428.05

Options Trading with Elliott wave, Neo wave and Time cycles – Learn to trade Stocks & Options along with Open Interest profile, Volume profile, KST Time indicator, 5 clear Trade setups for Options buying in Options Masterclass scheduled on 15th and 16th April, combine this to other level of forecasting with Master of Waves (MOW) on 6th – 7th May 2023. Both this combined courses is called Become Market Wizard (BMW). Act now and learn to generate passive source of Income, Limited seats only - Know More.