Nifty “closed” at lifetime high levels on 16th June 2023 at 18826. It just missed crossing above the 18887 which is previous high levels touched on 1st December 2022.
Let us look at the overall Elliott wave perspective to understand the maturity of trend and if more steam is left over coming days.
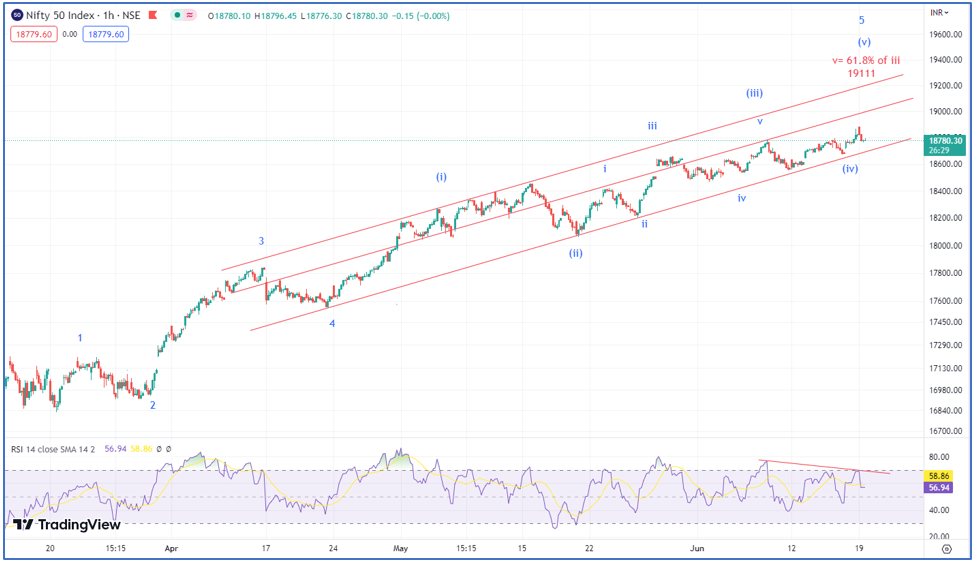
Nifty hourly chart –
Elliott Wave analysis:
Nifty path ahead – As shown in Nifty hourly chart, rise from the lows of 16828 is in impulse pattern that consists of 5 waves. There is extension in wave 5. Prices are also moving in red channel and currently wave (v) of 5 ongoing. As per this Nifty can hit lifetime highs above 18887 levels and eventually move to the levels of 19111. This is where wave v is 61.8% of wave (iii).
Wave personality suggests that wave (v) is usually associated with slower momentum and we can see the same on the above chart where RSI is making lower highs with prices making higher highs.
It is prudent to avoid catching a top unless we see close below prior week’s low which is near 18530 over short term. For nearly 12 weeks there is not a single close below prior weekly low on index and so it is still buy on dips. Many are trying to catch a top here as the momentum is slower but do remember that prices can continue to rise with slower momentum unless price action confirms.
Master of Cycles – Learn the science of Trading Time in simple step by step process. Hurst’s Time cycle technique combined with KST, Gann square of 9. This course is for everyone looking forward to increase their accuracy by timing the market and trade profitably using the scientific approach to trading. Online live event on 24th – 25th June 2023, Only a few seats left.