Tuesday, January 31, 2023

 Adani Enterprise – Elliott Wave with Time Cycles – Will It Break 3100?

Elliott wave along with Time Cycles help us to understand the maturity of trend with clear trade setups.

Adani Enterprise FPO of 20000 crore is in jeopardy post the accounting fraud report issued by US research firm Hindenburg just before the FPO was about to open.

Adani Enterprise Daily chart:

Elliott wave analysis – Adani Enterprise looks to have completed a clear 5 waves on upside post which we are seeing a collapse. The stock has corrected till 50% retracement level of the rise with next support near 2547 which is 61.8% levels.

The major trend for the stock looks to have reversed on downside as the fall is impulsive and we are currently in 3rd wave which is most violent. Post completion of wave iii we can expect overlapping rise in form of wave iv that will retrace prices back towards 3100 – 3200 levels. After that the downtrend can again resume probably towards 2547 or lower levels. So from medium term perspective the stock looks to be in sell on rise mode.

55 Days Time cycle – We can see that stock is managing to form a low near 55 days since 2022. However, the magnitude of rise differs. As the major trend is now on downside we can expect only a pullback in form of wave iv. So a relief rally is possible post 9th February 2023 which is 55 Days cycle low.

In a nutshell, breach below 2715 will resume downtrend in this stock towards 2547 levels and break above 3000 is must which will take prices towards 3100 – 3200 zone which is also the FPO offer levels.

Master of Cycles – Learn the complete science of Trading using Hurst’s Time Cycles along with price forecast and Time the trade to very Day, Hour and Minute. Only a few seats left, Live Online event on 11th – 12th February 2023. Know more here


Wednesday, January 25, 2023

 SUNFLAG: Combining Rounding Bottom with Time Cycle

We had applied ichimoku indicator on SUNFLAG and were able to capture a 6.25% move in a single day till now. You can also use these to identify stocks with momentum for short-term trades.

While trading the market it is important to understand the behaviour of the market. Using price action along with Time we can predict price moves in stock with high accuracy. Check out how we recently identified one such breakout in SUNFLAG.

We published SUNFLAG analysis in "The Financial Waves Short Term Update" on 24th January 2023 which our subscribers receive pre-market every day. Check out below the detailed research report that we published.


SUNFLAG Weekly chart as on 24th January 2023: (Anticipated)


SUNFLAG Hourly chart as on 24th January 2023: (Anticipated)

SUNFLAG (Anticipated)Weekly chart as on 25th January 2023: (Happened)

Wave analysis as on 24th January 2023

SUNFLAG has been moving higher recently and intact in strong uptrend. In the previous session it closed with a gain of 1.39%.

On the weekly chart, in the previous session prices formed a bullish candle. A weekly close above 137 level will confirm breakout of the rounding bottom pattern. We have shown ADX indicator which gives an indication if the stock is trending or in a trading range. The low readings of ADX indicates that the stock is in a range. The adx of this stock is 43.35 giving an indication of a trending market. The reading above 25 means strong directional strength

As shown on the hourly chart, price has recently bounced from the ichimoku cloud which can act as near-term support zone. Closest support is placed at 130.

In short, trend for this stock is positive. Use dips towards 136-137 as a buying opportunity for a move towards 155-157 levels as long as 130 holds on the downside.

Happened

The stock moved as we expected and have given breakout of rounding bottom with huge volume. In such choppy market we have managed to identify such stock which has potential to show further up move. We have plotted 40 weeks’ Time cycle in which it has captured many important lows and recent low made near 90 levels which was captured by our cycle and since then stock has shown an exceptionally well rally.  

For now, we can expect this rally to continue. One should avoid catching tops and use dips to ride the trend.

Master of Cycles – It is possible to forecast price using Time cycles as well and this trading secret is known only to a limited few. We will be relieving the entire science of Time trading using Hurst’s Time cycles, Gann sq of 9 and Price Time forecasting on 11th – 12th February 2023, Early Bird ends on 26th January 2023 – Act now, Know more here

Monday, January 23, 2023

 Nifty Lunar Cycle along with 55 Days Time Cycle – Is it Time to Buy?

Market movement is governed by cycles of Time. This means that the lows and tops are formed in rhythmic fashion and not randomly.

Many thinks that events are the reason for movement of stocks or indices but that is not the case.

Below chart of Nifty shows Lunar cycle along with Full Moon (highlight below the price) and No moon (empty circle above the price)

Nifty Lunar and 55 Days Time Cycles


As shown in above chart since the low formed at 15200 on most of the No moon or Amvasya we have seen market forming a low and reversing on the upside from there for a period of 3 days. 21st January 2023 marked No Moon or Amavasya, so as per this we can expect buyers to have upper hand over next 2 to 3 days.

55 Days Time Cycle – Most of the lows formed by Nifty is every 55 Days Time period. This is derived as per scientific approach of Hurst’s Time cycles. The red dotted line represents the average 55 days cycle. The same cycle is now due again on 24th January 2023. So the confluence of Lunar and 55 Days Time is suggesting that Bulls can have upper hand from here on which can also result into a Pre- Budget rally.

Price action -  It is important to combine price action along with Timing tools to ensure correct application. Time trading requires proper trade setups and if understood correctly can result into sharp rise in trading accuracy and forecasting ability. So, break above 18180 will bring price and Time both in sync on buy side.

In a nutshell, when Time is supportive chances of valid breakouts are higher. This way one can avoid false breaks.

 Isn’t this astonishing to see how well the Time governs stock market and events are also following it extremely well.

We apply this concept of Time even on 15 minutes and 5 minutes Time frame and the same has worked out amazing for our Mentorship participants. It has lead to transformation and we call this Elite group of traders as #TimeTraders.

Master of Cycles – It is possible to forecast price using Time cycles as well and this trading secret is known only to a limited few. We will be relieving the entire science of Time trading using Hurst’s Time cycles, Gann sq of 9 and Price Time forecasting on 11th – 12th February 2023, Early Bird ends on 26th January 2023 – Act now- Know more here

Mentorship on Timing the Markets - Be a part of upcoming Mentorship on Timing the Markets with early bird ending on 5th March. Learn the science of Trading the markets with an Edge, discipline, Options trading strategy, Algo creation and much more - Know more


Thursday, January 19, 2023

 Bank Nifty 54 Days’ Time Cycle - Must See!

Time Cycles are powerful studies that can give reversal areas and this if combined with price action can give amazing trade setups with higher accuracy.

Below is the chart of Bank nifty index along with 54 Days Trading Time cycle.


Bank Nifty 89 Period Time Cycle


 Time Cycle analysis: The best way to enter the trend is on the basis of Time cycles. Cycles are essentially used to capture lows. In the above chart as well, we can see most of the lows are formed on our cycle and after every 54 period, Bank Nifty has shown a positive reversal. If prices confirm along with Time it can give best conviction for traders.

Yesterday’s low was also formed exactly on our cycle near 42119 levels. As of now, any move above 42720 will turn time on the positive side but price action is must to confirm the same.

Same concept of Time can be applied to various time frames like 15 minutes time frame and even 5 minutes time frame which can help traders to time the market.

3 Month of Mentorship - Learn the science of Timing the market over more than 3 months with lifelong association, live trading sessions. Also, creation and everything focusing on Time trading from stock market expert Ashish Kyal, CMT, Author. Register here

Wednesday, January 18, 2023

 Nifty Head & Shoulder pattern with Gann target will it work again?

Nifty 15 Mins Chart


In the above chart, we can see that, Nifty has formed bottoming inverse Head & Shoulder pattern on the 15 mins time frame. Prices have also given a breakout of the neckline and now we can expect it to move in an upward direction with a target of 18250 which is near to our Gann level of 18293. It is valid until low of shoulder which is near 17920 level remains intact on the downside. Along with this KST indicator is also in favour so, overall view is likely to remains bullish.  

We have successfully captured a top in December 2022 at 18700 with Head & Shoulder with Gann target of 17756 and now we are trying to catch bottom for Gann target of 18293, will it work again!

Gann levels of 18293 and 17756 has worked out extremely well and provided opportunity for positional traders to buy and sell near these levels.

In nutshell, Prices which were trading in a range has finally given a break on the upside and managed to sustain above it. Now we can expect it to move towards 18250 as long as 17920 remains intact on the downside.

3 Month of Mentorship - Learn the science of Timing the market over more than 3 months with lifelong association, live trading sessions. Also, creation and everything focusing on Time trading from stock market expert Ashish Kyal, CMT, Author. Register here

Tuesday, January 17, 2023

 LT: Combining Diametric Pattern with Ichimoku cloud


We published about LT in July 2022 and predicted a possibility of good returns in the coming months in our Monthly Research report. Check out the research we had published on 2nd August itself – This stock has managed to hold its gain and gave more than 20% returns in less than 5 months of time and made a high of 2210 levels.

While trading the market it is important to understand the behaviour of the market. Using price action along with we can predict price moves in stock with high accuracy. Check out how we recently identified one such breakout in Larsen & Tourbo. You can also use these to identify stocks with momentum for short-term trades.

Larsen & Tourbo Weekly chart as on 2nd August 2022: (Anticipated)

Larsen & Tourbo Daily chart as on 2nd August 2022: (Anticipated)


Larsen & Tourbo Weekly chart as on 17th January 2023 : (Happened)


Wave analysis as on July 2022

Larsen and Toubro are one of the important components of the capital good index which has weight age of 3.1% in Nifty. The Company is involved in the business of Engineering, construction and manufacturing. It is one of the largest and most respected Companies in India’s private sector. L&T is one of them which has been intact in a medium to long term uptrend.

On the weekly chart of Larsen & Turbo (LT), the long consolidation from 2008-2020 was in form of wave 4 in a form of bow tie Diametric pattern. From the lows near 680, prices climbed the high near 2078 levels in the year of 2022. This entire price movement completed intermediate degree wave 1. After that stocks remained under corrective mode till the mid of 2022. Bulls now have taken control again and started to rise. Prices have retraced almost 0.382% of wave 1. Since price moved below the cloud in June and moved back above it, any move above 1920 will only confirm that wave 2 has completed its course as it will break the ichimoku cloud on the upside.

Now let us come to daily chart to understand the recent trend, Intermediate wave 1 has been completed near the highs of 2078 levels and later started to move lower within the channel in the diametric fashion. Primary wave 5 is moving on the upside and forming Impulse Terminal pattern and hence internal legs were corrective in nature. Any move below 1640 will suggest that the up move was wave x and another set of correction might have started on the downside. Closest support as per the average is near 1640 levels.

The vertical lines on the daily charts are the time cycles which are used to find the important swing lows. This time cycles are used to time our entry in the trade. We can clearly see that LT tends to follow 89 Days cycle very well. Next low is likely to appear in September 2022. Till then we can expect the stock to consolidate with positive bias.

In nutshell, the short-term trend will remain positive and one can buy on dips. Whereas, any move above 1920 can confirm conversion of upside reversal. Whereas any move below 1600 will indicate that correction is still ongoing.

Happened

When we had recommended the stock, when it was trading near 1800 levels and since then prices moved more than 20% in 5 months of span. Prices made a low near our cycle and after breaking the swing high which was near 1900 a good rally was witnessed.

Currently, wave iii is unfolding on the upside which is considered as the strongest one. All eyes are on an 89-period cycle which is due later this month.

3 Month of Mentorship - Learn the science of Timing the market over more than 3 months with lifelong association, live trading sessions. Also, creation and everything focusing on Time trading from stock market expert Ashish Kyal, CMT, Author. Register here

Monday, January 16, 2023

Nifty Patterns, Elliott Wave, Neo wave – Cannot be More Accurate!

 Nifty Patterns, Elliott Wave, Neo wave – Cannot be More Accurate!

Elliott wave along with Technical analysis patterns like Head & Shoulder with Diametric can give the much needed edge for Trading.

Below are the various charts shown from daily research report and from different webinars conducted live with 100s of participants.

Nifty hourly chart catching top near 18880 (Anticipated on 1st December 2022)


Nifty Head & Shoulder pattern (Anticipated on 16th December 2022) before the crash to 17670 levels


Nifty Neo wave Diametric pattern forecast during Master of Waves session on 7th – 8th January 2023


Nifty happened as on 16th January 2023


Above charts are picked up from different time frame and each of the forecasts has worked out extremely well.

The first chart where the major top was captured using simple Elliott wave when Nifty touched 18880 levels on 1st December 2022. From there prices crashed by more than 1200 points to 17760 levels. This was done using simple Elliott wave impulse pattern.

Nifty second chart – shows classical topping Head & Shoulder pattern which has been published in daily research report – The Financial Wavesshort term update on 16th December 2022 and prices broke the neckline near 18500 and moved down sharply to the target of 17760 levels precisely as expected.

Nifty third chart – shows Diametric pattern and was forecasted that a leg on upside in form of wave f followed by wave g on downside to be expected. Prices moved precisely on upside completed wave f then moved lower and completed wave g.

Post completion of wave g we saw an up move which can be wave x or a fresh up leg the confirmation of which will be obtained on hourly close above 18000 levels.

In a nutshell, Nifty has been moving precisely to the tune of patterns, Elliott wave and Neo wave as can be seen above which is enough proof to show that these techniques work! When majority are guessing the direction we are able to adopt scientific approach towards trading and with these techniques and tools one can sharply increase their trading accuracy.

Mentorship on Timing the Market along with complete plan and goal – 3 Months of Mentorship starts in March 2023 with live session of Master of Cycles in February 2023. Act now to Trade with an edge of Time and be a part of Elite community we call #TimeTraders. Fill below form for more details. Register here

Sunday, January 15, 2023

Trade F&O using Candlesticks & Time cycle | By Ashish Kyal


Get ready to Learn the stock market with high accuracy using Candlesticks & Time Cycles with Simple Trade Setups by Stock Market Expert Ashish Kyal, Author, CMT
Learn the science of Timing the market over more than 3 months with lifelong association, live trading sessions, Algo creation and everything focusing on Time trading from stock market expert Ashish Kyal, CMT, Author. Register here OR Contact us on +919920422202 -------------------------------------------------------------------------------------------------------------
Ashish Kyal Trading Gurukul is initiative to educate systematic way of trading using simple step by step techniques of Technical analysis to ensure maximum profit with minimum losses.
Android Application Link - https://play.google.com/store/apps/details?id=co.lenord.esiad iOS application Link - https://apps.apple.com/in/app/myinstitute/id1472483563 Download "My Institute" App and enter org code: esiad --------------------------------------------------------------------------------

Friday, January 13, 2023

Nifty Live Gann square + Time Cycles | Ashish Kyal


Nifty trading using Gann square of 9 with key levels and path ahead with 55 Days Time cycle for Trading effectively by Stock Market Expert Ashish Kyal, CMT, Author Learn the science of Timing the market over more than 3 months with life long association, live trading sessions, Algo creation and everything focusing on Time trading, Register here - https://www.wavesstrategy.com/mentorship OR Contact us on +919920422202 -------------------------------------------------------------------------------------------------------------- Ashish Kyal Trading Gurukul is initiative to educate systematic way of trading using simple step by step techniques of Technical analysis to ensure maximum profit with minimum losses. -------------------------------------------------------------------------------- Android Application Link - https://play.google.com/store/apps/details?id=co.lenord.esiad iOS application Link - https://apps.apple.com/in/app/myinstitute/id1472483563 Download "My Institute" App and enter org code: esiad

Wednesday, January 11, 2023

Bank Nifty Option Trading with Time Cycles on 15 Minutes

Option trading can be successful only by understanding the essence of Time.

Either Options buying or selling the most important aspect is to know if the Time is on the buy or sell side and this combined with Candlestick can simply convert your losing positions into profitable ones.

What are Time techniques and cycles? It is a very simple and easy concept that can help to understand the date and time when markets are reversing from down to up.

Below is the chart of Bank Nifty along with Time cycles reversals on a 15 minutes chart.

Bank Nifty 15 minutes chart:

Time Traders – The vertical lines shown above represents Time reversal areas. During the uptrend this time cycles worked like magic giving opportunity to buy everytime prices moved within this time zone and then formed a positive Candlestick pattern.

Many of the breakout fail only because time is not in favor and above chart clearly represents that by buying everytime with price confirmation near the cycle low gave amazing opportunity to trade.

Now during the downtrend let us understand how the cycle changes. We combine both Price and Time confirmation to take a long trade. For taking the short positions we need to see break below the time cycle low. We can see that at 1.45 pm during the latest cycle the low was broken which gave a classic sell signal. So when the cycle low is taken out by prices it confirms to take a sell trade.

Now the next cycle is due on Friday the 13th and we will closely watch it near 10:15 am. Yes exact time of reversal can be predicted. If near the zone of 10.15 time we get price confirmation by Candlestick it can provide another amazing opportunity to buy Options if the positive pattern is seen or else if low is broken it will be opportunity to sell calls.

In a nutshell, Time is the essence of Trading Options successfully but many are ignoring this most important element of trading by focusing merely on prices.

Mentorship on Timing the Market – To create the  passive source of Income, achieve financial freedom and trade with an edge with consistency by leveraging options learn the science of Time which will be the focus for Mentorship March 2023, check here 


Monday, January 9, 2023

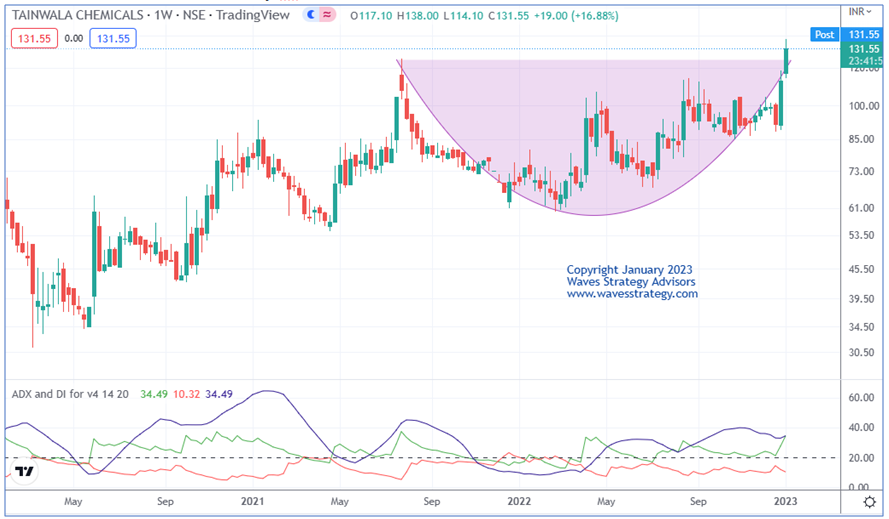
TAINWALCHM: Combining Rounding Bottom with ADX

 We had applied ADX indicator on TAINWALCHM and were able to capture a 19% move in a single day. You can also use these to identify stocks with momentum for short-term trades.

While trading the market it is important to understand the behaviour of the market. Using price action along with we can predict price moves in stock with high accuracy. Check out how we recently identified one such breakout in TAINWALCHM.

We published TAINWALCHM analysis in "The Financial Waves Short Term Update" on 6th January 2023 which our subscribers receive pre-market every day. Check out below the detailed research report that we published.

TAINWALCHM Weekly chart as on 6th January 2023: (Anticipated)

TAINWALCHM Weekly chart as on 9th January 2023: (Happened)

Wave analysis as on 6th January 2023

TAINWALCHM has been moving higher recently and intact in strong uptrend. In the previous session it closed with a massive gain of 12.97%.

On the weekly chart, in the previous session prices formed a bullish candle. A weekly close above 125.50 will confirm breakout of the rounding bottom pattern. We have shown ADX indicator which gives an indication if the stock is trending or in a trading range. The low readings of ADX indicates that the stock is in a range. The adx of this stock is 34.49 giving an indication of a trending market. The reading above 25 means strong directional strength

As shown on the hourly chart, price is trading above the ichimoku cloud which indicate that the short-term bias is bullish. Closest support is placed at 124.

In short, trend for this stock is positive. Use dips towards 127-129 as a buying opportunity for a move towards 140-142 levels as long as 124 holds on the downside.

Happened
The stock moved as we expected and have given breakout of rounding bottom with huge volume followed this stock has gained more than 19% from the dip levels and achieved our target and moved above it.

Join the Exclusive premium Telegram community for research reports and Advisory Calls on Nifty, Bank Nifty, stocks, Commodity, and Currency along with charts, an explanation of Elliott wave counts upto 30% OFF. Access now here 

3 Month of Mentorship - Learn the science of Timing the market over more than 3 months with lifelong association, live trading sessions, Algo creation and everything focusing on Time trading from stock market expert Ashish Kyal, CMT, Author. Register here

Friday, January 6, 2023

Nifty Trading using Gann and Neo wave, Time to Buy or Sell? | Ashish Kyal


Nifty - is it forming double bottom pattern or much lower levels possible. if Gann level of 17756 breaks then we can head to 17540 which is target as per Diametric pattern - see here in this video is it Time to Buy or Sell? Master of Waves (MOW) – Learn to Trade Options using Elliott wave, Neo wave and Hurst's Time Cycles and equip with excellent trade setups for trading Intraday and positional along with forecasting the markets on 7th and 8th January 2023. Register now and Be a part of this Elite Traders community. Here is the link to register - https://www.wavesstrategy.com/mowoffer Ashish Kyal Trading Gurukul is initiative to educate systematic way of trading using simple step by step techniques of Technical analysis to ensure maximum profit with minimum losses. -------------------------------------------------------------------------------- Android Application Link - https://play.google.com/store/apps/details?id=co.lenord.esiad iOS application Link - https://apps.apple.com/in/app/myinstitute/id1472483563 Download "My Institute" App and enter org code: esiad -------------------------------------------------------------------------------- Sebi registered Research Analyst Waves Strategy Advisors, For daily advisory services and research reports visit the website Website - https://www.wavesstrategy.com -------------------------------------------------------------------------------- International Book by Ashish Kyal - Effective Trading in Financial Markets Using Technical Analysis - https://www.wavesstrategy.com/books

Monday, January 2, 2023

Nifty – Diamond Diametric Pattern, Fibonacci supports and ROC!

Elliott wave is GPS of the market and gives the path prices can probably travel.

Nifty has been moving in lacklustre fashion over past few days but with high volatility. We have shown the Neo wave counts along with ROC indicator.

Nifty hourly chart:


Nifty Neo wave pattern is showing post completion of wave c near 18696 prices moved sharply lower in form of a-b-c pattern to 17800 levels. After that there is a pullback on upside but the momentum is lacking.

The entire structure on downside looks like Expanding pattern and we are yet to break above 18210 followed by 18250 levels which is immediate hurdle.

Prices also found support near 50% Fibonacci retracement of the entire rise.

ROC indicator: As can be seen in ROC indicator we are witnessing reversals between 1.61 and -1.69 levels. ROC is finding support near 0 line but is showing slower momentum as compared to the earlier bounce we saw from wave c. This suggests upside movement is slower and can be therefore wave d of Expanding pattern or probably running Diametric.

Diametric pattern – is a 7 legged corrective pattern with expansion followed by contraction later. This is known as Diamond shaped Diametric pattern. This is only an assumption that prices might be forming this structure and one needs to get signal as per two stage confirmation technique of Neo wave with support near 18080 followed by 17980 levels.

In a nutshell, it seems we are in wave d of Diametric pattern. Now that the probable pattern is known, one can focus on price action using smaller time frames two stage confirmation technique of Neo wave to enter prudently at good risk reward ratio. Thus a complete trading system can be formed using Elliott wave / Neo wave method. 

Be a part of Master of Waves on the 7th and 8th of January which will focus on the Elliott wave, Neo wave, Hurst’s Time cycles, and also a special section on Trading using Gann square of 9. Be a part of this Elite Trading Community #wavetraders. Limited seats. Fill the form here for more details