Friday, October 29, 2021

Option Trading using Neo wave and OI Profile by Ashish Kyal, Author, CMT


Mentorship On Timing the Market for the FIRST TIME EVER. Trade-in Real-Time With Discipline and Confidence using Time Cycles. A scientific Approach to Successful Trading. Limited Seats only. Know more- https://www.wavesstrategy.com/mentorship

We would love to connect with you on Social Media: Twitter - https://twitter.com/kyalashish/ Instagram - https://www.instagram.com/kyalashish/ Facebook - https://www.facebook.com/AKTradingGurukul Telegram - https://t.me/AKTradingGurukul LinkedIn - https://www.linkedin.com/in/ashishkyal/ ---------------------------- "SEBI “Research Analyst” No: INH000001097 Visit us : https://www.wavesstrategy.com/ Write to us on : helpdesk@wavesstrategy.com Contact us: +91 9920422202

Thursday, October 28, 2021

Nifty Crashed, Is it Lunar Cycle, What is Next?


Mentorship On Timing the Market for the FIRST TIME EVER. Trade-in Real-Time With Discipline and Confidence using Time Cycles. A scientific Approach to Successful Trading. Limited Seats only. Know more- https://www.wavesstrategy.com/mentorship

We would love to connect with you on Social Media: Twitter - https://twitter.com/kyalashish/ Instagram - https://www.instagram.com/kyalashish/ Facebook - https://www.facebook.com/AKTradingGurukul Telegram - https://t.me/AKTradingGurukul LinkedIn - https://www.linkedin.com/in/ashishkyal/ ---------------------------- "SEBI “Research Analyst” No: INH000001097 Visit us : https://www.wavesstrategy.com/ Write to us on : helpdesk@wavesstrategy.com Contact us: +91 9920422202

Wednesday, October 27, 2021

TCI Express – Power Of Time Cycles.

 It is possible to capture explosive moves in stocks using price patterns and advanced techniques like Time cycles.

Today morning we published TCIEXPRESS  in "The Financial Waves Short Term Updatewhich our subscribers receive pre-market every day. Check out below the detailed research report that we published.

TCI Express Daily Chart as on 26th October 2021 (Anticipated)

TCI Express Daily chart as on 27th October 2021 (Happened)

TCI Express Hourly Chart

Waves analysis-

On the daily chart, in the previous session, the stock formed a bullish candle. We can see rounding bottom pattern has formed. Prices have given close above 281 level which confirms breakout from the pattern. Price is trading above the Ichimoku cloud which indicates that the short term bias is bullish.

On the hourly chart, the vertical lines represent 153 hour time cycle. As we can see that as prices approach this cycle an important low is formed. This helps us to time the market correctly. After the recent cycle of low formation, this is a perfect opportunity to buy.

In short, the trend for this stock is positive. Use dips towards 1760-1750 as buying opportunity for a move towards 1970-2000 levels as long as 1680 holds on the downside.

Happened-

After we published the report the stock made a high near 1959 levels! We also gave a buy call on TCIEXPRESS on CNBC AWAAZ KHILADI NO 1 game show at 1785 and it hit 9% target at 1950 within a day!

Even in such elevated markets, want to know which stocks to pick up which gives better returns over the period of one year, this DIWALI. Get 4 stocks which are sector based outperformer. Subscribe to our this year Diwali Picks 

Mentorship on Timing the Markets for the FIRST TIME EVER starts November 2021 – In this Mentorship program, all the necessary tools are given right from stock selection methods, strategy, follow-up action to derive a complete trade setup in step by step fashion. Contact us on +919920422202

Tuesday, October 26, 2021

IRCTC Time Cycles, When Will It Rally AGAIN!


Mentorship On Timing the Market for the FIRST TIME EVER. Trade-in Real-Time With Discipline and Confidence using Time Cycles. A scientific Approach to Successful Trading. Limited Seats only. Know more- https://www.wavesstrategy.com/mentorship

We would love to connect with you on Social Media: Twitter - https://twitter.com/kyalashish/ Instagram - https://www.instagram.com/kyalashish/ Facebook - https://www.facebook.com/AKTradingGurukul Telegram - https://t.me/AKTradingGurukul LinkedIn - https://www.linkedin.com/in/ashishkyal/ ---------------------------- "SEBI “Research Analyst” No: INH000001097 Visit us : https://www.wavesstrategy.com/ Write to us on : helpdesk@wavesstrategy.com Contact us: +91 9920422202

Will Nifty Break 18k Levels Or Time To Buy, Elliott – Neo wave Pattern with OI?

Nifty has moved precisely as we expected and showed in previous research on 20th October 2021 – Nifty 3 Powerful Indicators

Now let us look at the same chart again and see what is expected from here on using Advanced Elliott Wave technique – Neo wave with Open Interest analysis

Nifty hourly chart:

We can see that prices are moving lower in the form of wave d and this pattern can either form a Diametric or a Neutral Triangle. Diametric is a 7 legged corrective pattern and Neutral triangle looks like a Head & Shoulder. We are currently moving in form of wave d and a bounce back above 18300 is required to confirm that wave d is over and wave e is starting higher.

Ichimoku Cloud - As of now we can see that prices are just moving near the lower end of the Ichimoku Cloud and we now need a break below 17970 for negative price confirmation. This will turn the overall setup into sell on rise and indicate a Neutral Triangle pattern is probably under formation. Combination of Ichimoku cloud along helps trader not only as a signalling method but also for deriving trades.

Open Interest Profile – Nifty OI profile continues to indicate that 18k is very important level with highest Put OI build there. A break below 17950 – 17930 zone will suggest that the puts will not get nervous and start covering their short positions thereby accelerating the selling pressure once 17950 breaks.

During this time Bank Nifty has continued to rally sharply on upside with stocks like ICICI Bank, Axis Bank moving up and on other hand stocks like IRCTC, IEX which have been traders favourite on long side are crashing. This will result into traders getting stuck and simply guessing what is going on. It is a typical scenario of a Triangle pattern formation and few days of consolidation can be expected. This is how one can understand Wave personality.

Thus the above 3 different techniques continued to suggest that markets are at crucial juncture and we need to either see a break below 17950 for a bigger downside correction or a move above 18300 for some positivity. Selling options is going to be ideal during such scenario to make money from ongoing volatile movement.

3 Months of Mentorship on Timing the Markets – Early Bird Ends on 25th October 2021, Time the market using Simple, Easy and Effective Time cycle trading techniques with combination of Step by step methods using Candlesticks, Timing tools and Elliott waves, complete handholding, stock selection methods, Algo creation, Option trading with a complete Trade plan, to know more contact us on +919920422202 

Wednesday, October 20, 2021

3 Powerful Indicators on Nifty, You Cannot Miss!

By combining Ichimoku Cloud, Elliott Wave, and Open Interest analysis it is possible to form a powerful trade setup.

Diametric pattern is defined as per Neo wave and it consists of 7 legs. A peculiar behaviour of this pattern is that wave g tend towards equality with wave a, wave f tend towards equality with wave b and wave e tend towards equality with wave c.

Neutral Triangle Pattern: It is a triangle pattern in which wave c is the largest and wave d usually overlaps with wave a. This also looks like a topping Head & Shoulder pattern. Currently, Nifty is either forming a Diametric pattern or a Neutral Triangle and the nature of fall in wave d will confirm this.

Now look at the below chart for further understanding

Nifty 60 minutes chart:

Elliott wave analysis

Nifty on a 60 minutes time frame shows after Diametric pattern there was a dip in form of wave x and post that we might be forming a Neutral Triangle pattern or a Diametric again. Currently prices are in wave d of the same after forming a top in form of wave c near 18600 levels.

We are showing the path ahead on Nifty that can dip towards the Ichimoku cloud support and highest OI of Put option which is near 18000 and then there can be pullback on upside. This is also an assumption given the sharp fall of past few hours and rise in OI in call options near 18500 levels.

Open Interest analysis: 
OI profile chart shown along with prices gives further conviction for identifying key reversal areas. We can see that 18500 is near term resistance as there is high build up in OI for Call options of 18500 strike price and 18000 is highest OI for Put OI. Also 18400 is showing sharp rise in Call OI, so use pullback as shorting opportunity as long as 18400 – 18500 is intact and on downside expecting a move towards 18050 – 18k as per the path shown above. Also note this has to be evaluated as the market progresses and trade on basis of charts and patterns.

The above research clearly showcase how Ichimoku Cloud, Neo wave and OI profile can help in taking a clear trade setup for Option traders and form the strategy accordingly. These are simple yet powerful methods of forecasting and trading the markets.

Subscribe to the Multibagger, Momentum, Nifty / Bank Nifty calls that are derived on basis of these methods directly on WhatsApp / SMS and also get a research report along with it free to enhance your learnings.

Want to ride the momentum for 8% to 10% target with prudent risk reward and clearly defined stoploss – Get access to Momentum calls more here

Nifty / Bank Nifty calls – Want to trade only index on intraday or positional basis – check here

Mentorship on Timing the Markets: Mentorship starts in November that will ensure you become an Expert Trader with clear defined strategy, disciplined approach and science to forecast the markets. Time is the most essential element and we will provide over the period of 3 months all necessary tools required for one to become a profitable trader using Options. For more details Contact us on +919920422202.

Wednesday, October 13, 2021

TataMotors Time Cycles with Target, Nifty BN OI by Ashish Kyal, Author


Mentorship On Timing the Market for the FIRST TIME EVER. Trade-in Real-Time With Discipline and Confidence using Time Cycles. A scientific Approach to Successful Trading. Limited Seats only. Know more- https://www.wavesstrategy.com/mentorship

We would love to connect with you on Social Media: Twitter - https://twitter.com/kyalashish/ Instagram - https://www.instagram.com/kyalashish/ Facebook - https://www.facebook.com/AKTradingGurukul Telegram - https://t.me/AKTradingGurukul LinkedIn - https://www.linkedin.com/in/ashishkyal/ ---------------------------- "SEBI “Research Analyst” No: INH000001097 Visit us : https://www.wavesstrategy.com/ Write to us on : helpdesk@wavesstrategy.com Contact us: +91 9920422202

Tuesday, October 12, 2021

Nifty Huge Call Open Interest at 18k, Will it Cross But Momentum Is Waning!

 Nifty had been moving precisely as we have been forecasting to the very hour. We have been tweeting about Nifty movement with time on the tweeter handle @kyalashish and the move has been just precise.

Following research is simple and easy that shows how the smart traders assumed to be option writers are behaving. Majority of BIG Players prefer Option selling rather than Option buying as they understand the basic math of how Options work and the probability favors the sellers.

Nifty Open Interest Profile with Neo Wave Hourly chart:


Nifty above hourly chart clearly shows Call OI buildup around 18k levels and reduction in the Put OI near 18k. This suggest that the call writers are getting more confident on the upside and it is becoming increasingly difficult for Nifty to cross back above the psychological 18k mark.

Following was tweeted across on 11th October morning –


As per Elliott Wave Prices are moving in the form of triple corrective pattern and currently wave c is going on of the 3rd pattern. This might get complete around current zone and there is already a negative divergence between prices and RSI. This shows a slower momentum despite of the euphoria we are seeing around.

This time it is the index heavy weights like HDFC Bank, ITC, Reliance that has been managing to take index higher while others like TCS are correcting their overbought levels. During such times it is best to use Time Cycles for timing the market and follow Option writing strategy based on Time Cycle and Elliott wave techniques.

In a nutshell, Nifty has to cross above 18000 – 18060 levels to resume the uptrend. Failure to do that can result into short term time correction if not price. Basis of this information and research prudent option trading strategy can be formed and one can trade objectively.

3 Months Mentorship on Timing the Markets- Learn to time the market and trade with me for the period of 3 Months including Live trading, stock selection, Momentum and Multibagger stock identification, Timing the entry to the very Day, Hour and Minute using Time cycles and Elliott Wave analysis. Early Bird ends on 25th October 2021. Get access to MOC as soon as you register for Mentorship, Contact +919920422202 for more details

Friday, October 8, 2021

Option Trading Using Moving Average derived using Time Analysis


Time Forecasting and Cyclical Analysis Combining Hurst’s, Gann Cycles – Master of Cycles (MOC). It is thrilling to experience to trade with time in your favor. Learn this simple tool of timing the market to the very Day, Hour and Minute. Join now Master of Cycles Program on 09th & 10th October 2021. Enroll here
We would love to connect with you on Social Media: Twitter - https://twitter.com/kyalashish/ Instagram - https://www.instagram.com/kyalashish/ Facebook - https://www.facebook.com/AKTradingGurukul Telegram - https://t.me/AKTradingGurukul LinkedIn - https://www.linkedin.com/in/ashishkyal/ ---------------------------- "SEBI “Research Analyst” No: INH000001097 Visit us : https://www.wavesstrategy.com/ Write to us on : helpdesk@wavesstrategy.com Contact us: +91 9920422202

Thursday, October 7, 2021

Nifty outlook and what is Hurst's Time Cycles by Ashish Kyal, Author


Will Nifty break 17950 or 17730 and how Hurst's #TimeCycles can change the way you trade drastically? Get the answers in this video.

Time Forecasting and Cyclical Analysis Combining Hurst’s, Gann Cycles – Master of Cycles (MOC). It is thrilling to experience to trade with time in your favor. Learn this simple tool of timing the market to the very Day, Hour and Minute. Join now Master of Cycles Program on 09th & 10th October 2021. Enroll here
We would love to connect with you on Social Media: Twitter - https://twitter.com/kyalashish/ Instagram - https://www.instagram.com/kyalashish/ Facebook - https://www.facebook.com/AKTradingGurukul Telegram - https://t.me/AKTradingGurukul LinkedIn - https://www.linkedin.com/in/ashishkyal/ ---------------------------- "SEBI “Research Analyst” No: INH000001097 Visit us : https://www.wavesstrategy.com/ Write to us on : helpdesk@wavesstrategy.com Contact us: +91 9920422202

Monday, October 4, 2021

Sensex to reach 61000 Predicted by Time Cycles 8 Years Back! Believe It!

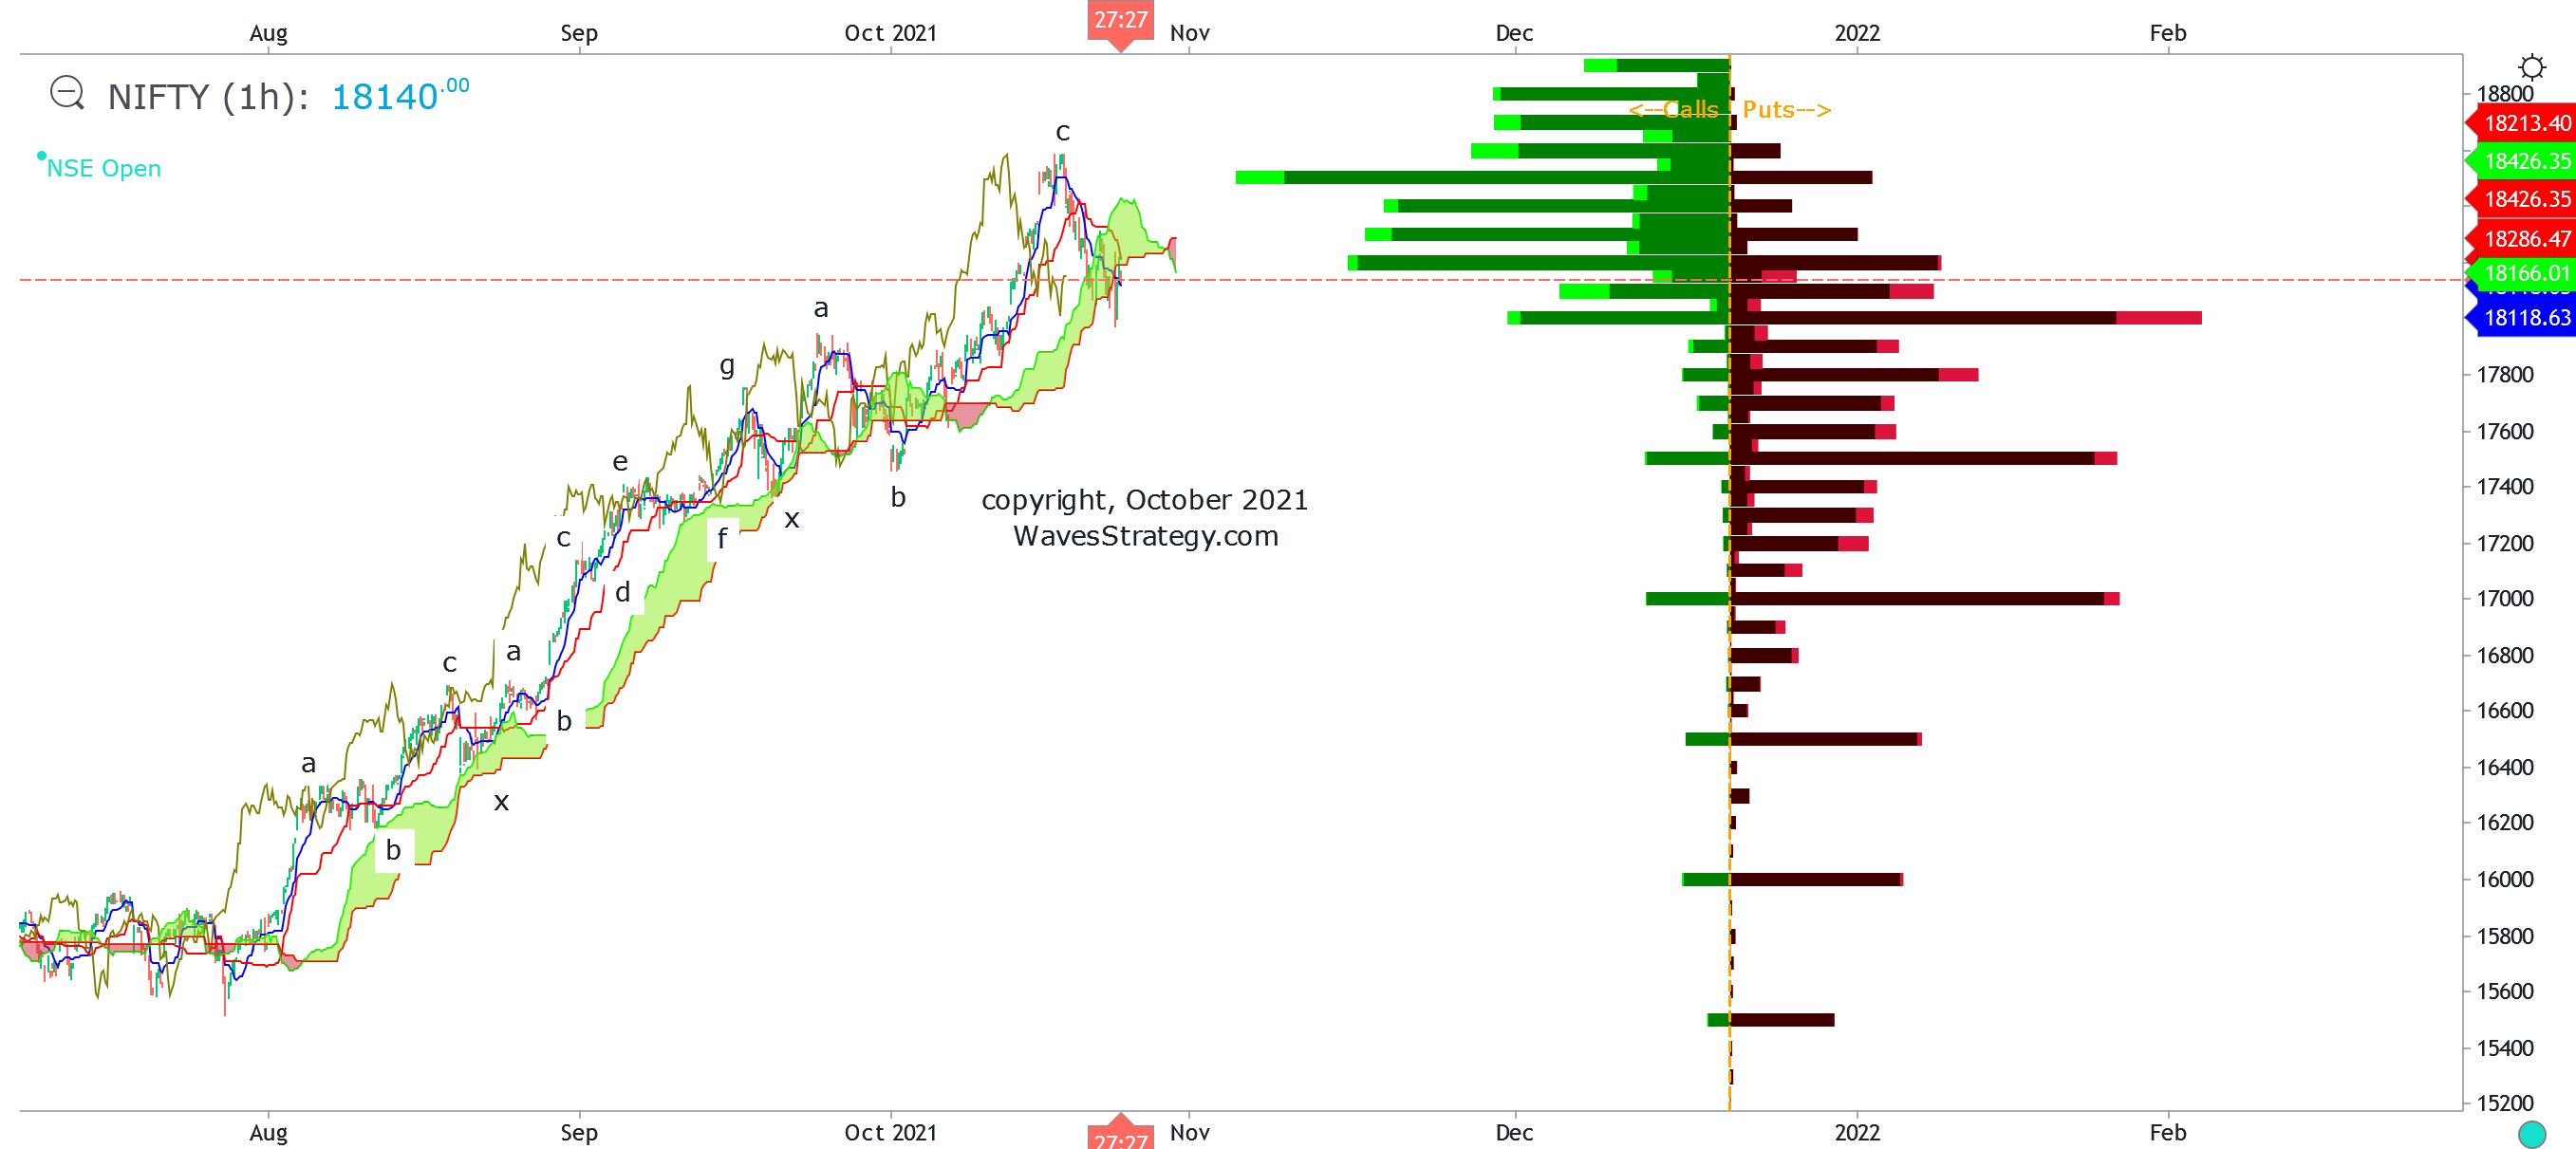
Sensex has been inching higher and touched lifetime highs of 60400 on 27th September 2021 and Nifty touched lifetime high levels of 17947.

In our monthly research published on 26th July 2013, we have clearly forecasted Sensex to touch 61000 in 7 to 8 years time frame and BankNifty to touch 40,000. BankNifty made a high of 38366 in September 2021.

Yes, This is something that looks unbelievable but see the below charts which was shown in the research in the Year 2013 when Sensex was near 19000 and Bank Nifty was near 12000 levels.

Sensex and Bank Nifty chart shown in year 2013


Sensex Happened as on September 2021

Following was mentioned in the year 2013-

In Figure 2 we are showing that Sensex can touch 61000 levels by 2020. 272 weeks bottoming Time cycles suggest lows should be formed by mid 2014. Time can be very dynamic and we have to give a leeway of + 10%. Time cycle is of 272 weeks and 10% gives 27 weeks of delay plausible. This can delay the start of new uptrend towards end of 2014 instead of mid 2014.

The target of 61000 is not overly optimistic. We have seen history, when from near 3000 levels Sensex rallied to 21000 i.e. an increase of 7 times in little over 5 years, Sensex was launched at 100 in 1979 and touched 21000 in early 2009 i.e. an increase of 210 times in mere 30 years. Such exorbitant value creations simply dwarf our estimation of 61000 in 6 to 7 years. At this juncture, the conjunction of Price and Time given by the above methods is compelling. It will be at this level of by mid 2014 that the market will by ripe to ride the next wave of bull trend on upside!

Following was mentioned for Bank Nifty in the year 2013

On Bank Nifty, the level of 26,000 & 40,000 might sound irrational or crazy at this point of time. But history shows that things that seem far of reach are still plausible if you apply objective techniques. The below chart itself shows that in 2002 Bank Nifty was trading at 900 levels and by end of 2007 it quoted at 10,000 levels. This is the power of a Bull trend. Bank Nifty increased multifold from 900 to 10,000 i.e. more than 10 times in 6 years. In 2002 when index was at 900 if someone would have predicted 10,000 people would have rejected that on the face and would have used the word “Crazy”. In 2009 March Bank Nifty was near 3400 level and by November 2010 the index touched 13300 levels i.e. a rise of almost 4 times in less than 2 years. But history of world markets let alone India has from time & again showed power that Bull trend has. In world financial markets everything that seems logical from fundamental perspective might not be so and everything that looks impossible might be one of the highest probable outcomes!

Happened: Sensex touched near 60400 and Bank Nifty touched high near 38400 in September 2021. The above shows that we are off only by a few months that too it was mentioned that 27 weeks delay is possible and here we are now BANG ON! Both these indices moved precisely as we expected despite of various events including Mr. Modi win in central Election, Demonetization, Trump thrown out of power, Pandemic of 2020, tensions between China and India, Crude turning negative in year 2020 and many more such events.

In a nutshell, above clearly showcase that there is power in Technical analysis, Elliott Wave and Time Cycles to forecast right from years to the very minute and if one applied it correctly can forecast the fate of stock market despite of the fundamental scenario and dooms day that prevailed during Covid-19 pandemic, But our targets are almost achieved now predicted 8 years back, Thrilled Yet!

Learn the power of Time Forecasting – Master of Cycles Live event on 9th – 10th October 2021, learn to trade with time to the very Day, hour and minute using Simple and Easy step by step process of Time Cycles. Ashish Kyal will be taking Limited Seats only - Time Forecasting combining Hurst’s and Gann Methods. Only a very few conducts it globally. Know more about Master of Cycles module here

Friday, October 1, 2021

Nifty Intraday Trade Strategy using Volume Profile, OI & TimeCycles


Time Forecasting and Cyclical Analysis Combining Hurst’s, Gann Cycles – Master of Cycles (MOC). It is thrilling to experience to trade with time in your favor. Learn this simple tool of timing the market to the very Day, Hour and Minute. Join now Master of Cycles Program on 09th & 10th October 2021. Enroll here
We would love to connect with you on Social Media: Twitter - https://twitter.com/kyalashish/ Instagram - https://www.instagram.com/kyalashish/ Facebook - https://www.facebook.com/AKTradingGurukul Telegram - https://t.me/AKTradingGurukul LinkedIn - https://www.linkedin.com/in/ashishkyal/ ---------------------------- "SEBI “Research Analyst” No: INH000001097 Visit us : https://www.wavesstrategy.com/ Write to us on : helpdesk@wavesstrategy.com Contact us: +91 9920422202