By combining Ichimoku Cloud, Elliott Wave, and Open Interest analysis it is possible to form a powerful trade setup.
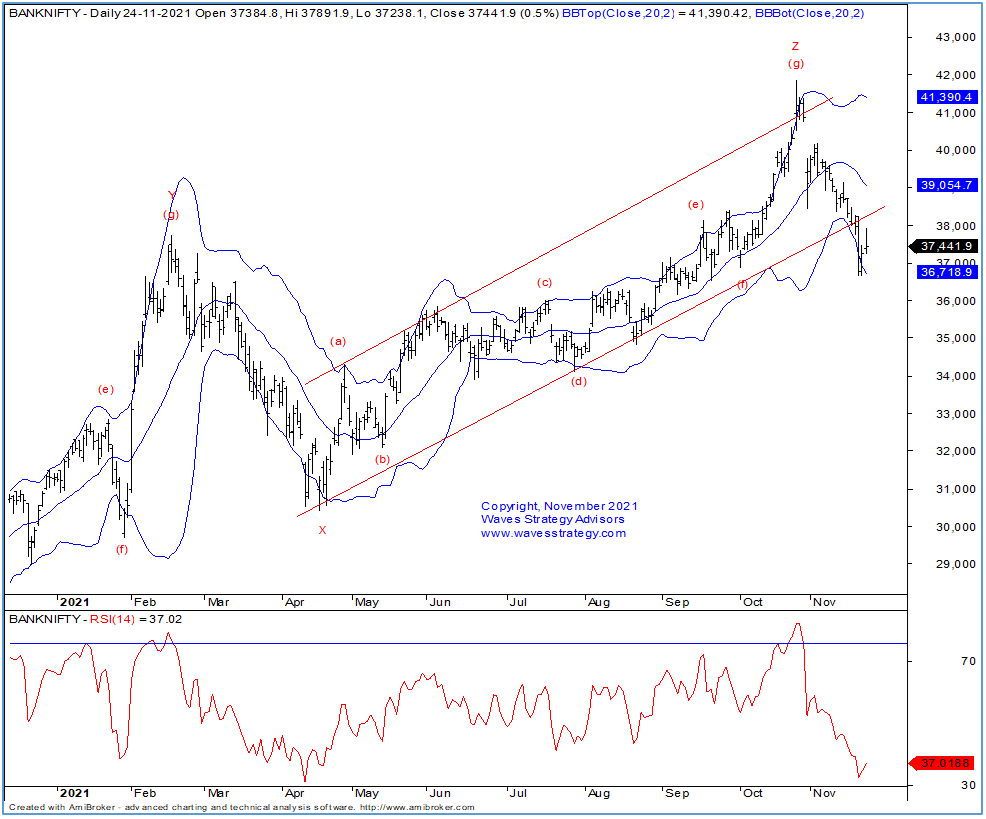
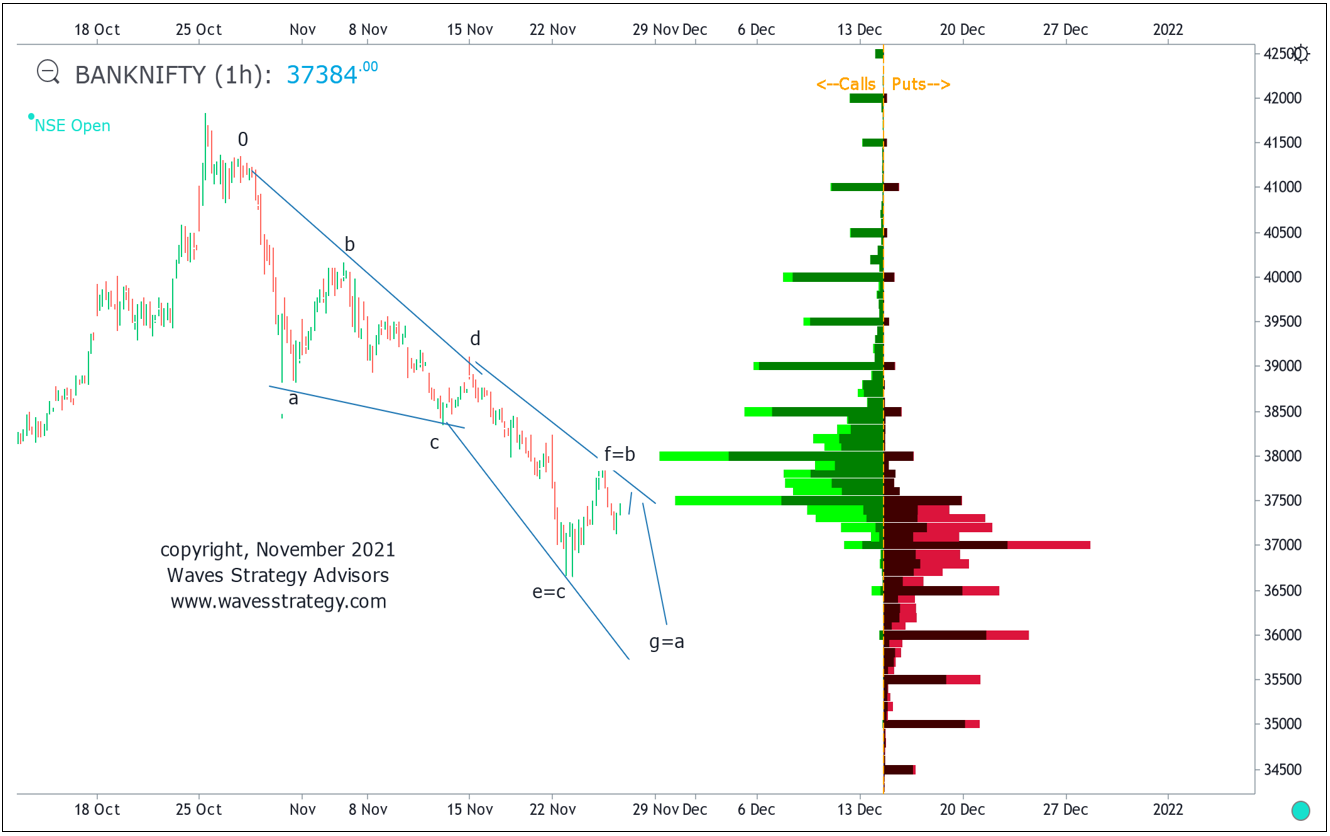
Diametric pattern is defined as per Neo wave and it consists of 7 legs. A peculiar behaviour of this pattern is that wave g tend towards equality with wave a, wave f tend towards equality with wave b and wave e tend towards equality with wave c.
Neutral Triangle Pattern: It is a triangle pattern in which wave c is the largest and wave d usually overlaps with wave a. This also looks like a topping Head & Shoulder pattern. Currently, Nifty is either forming a Diametric pattern or a Neutral Triangle and the nature of fall in wave d will confirm this.
Now look at the below chart for further understanding
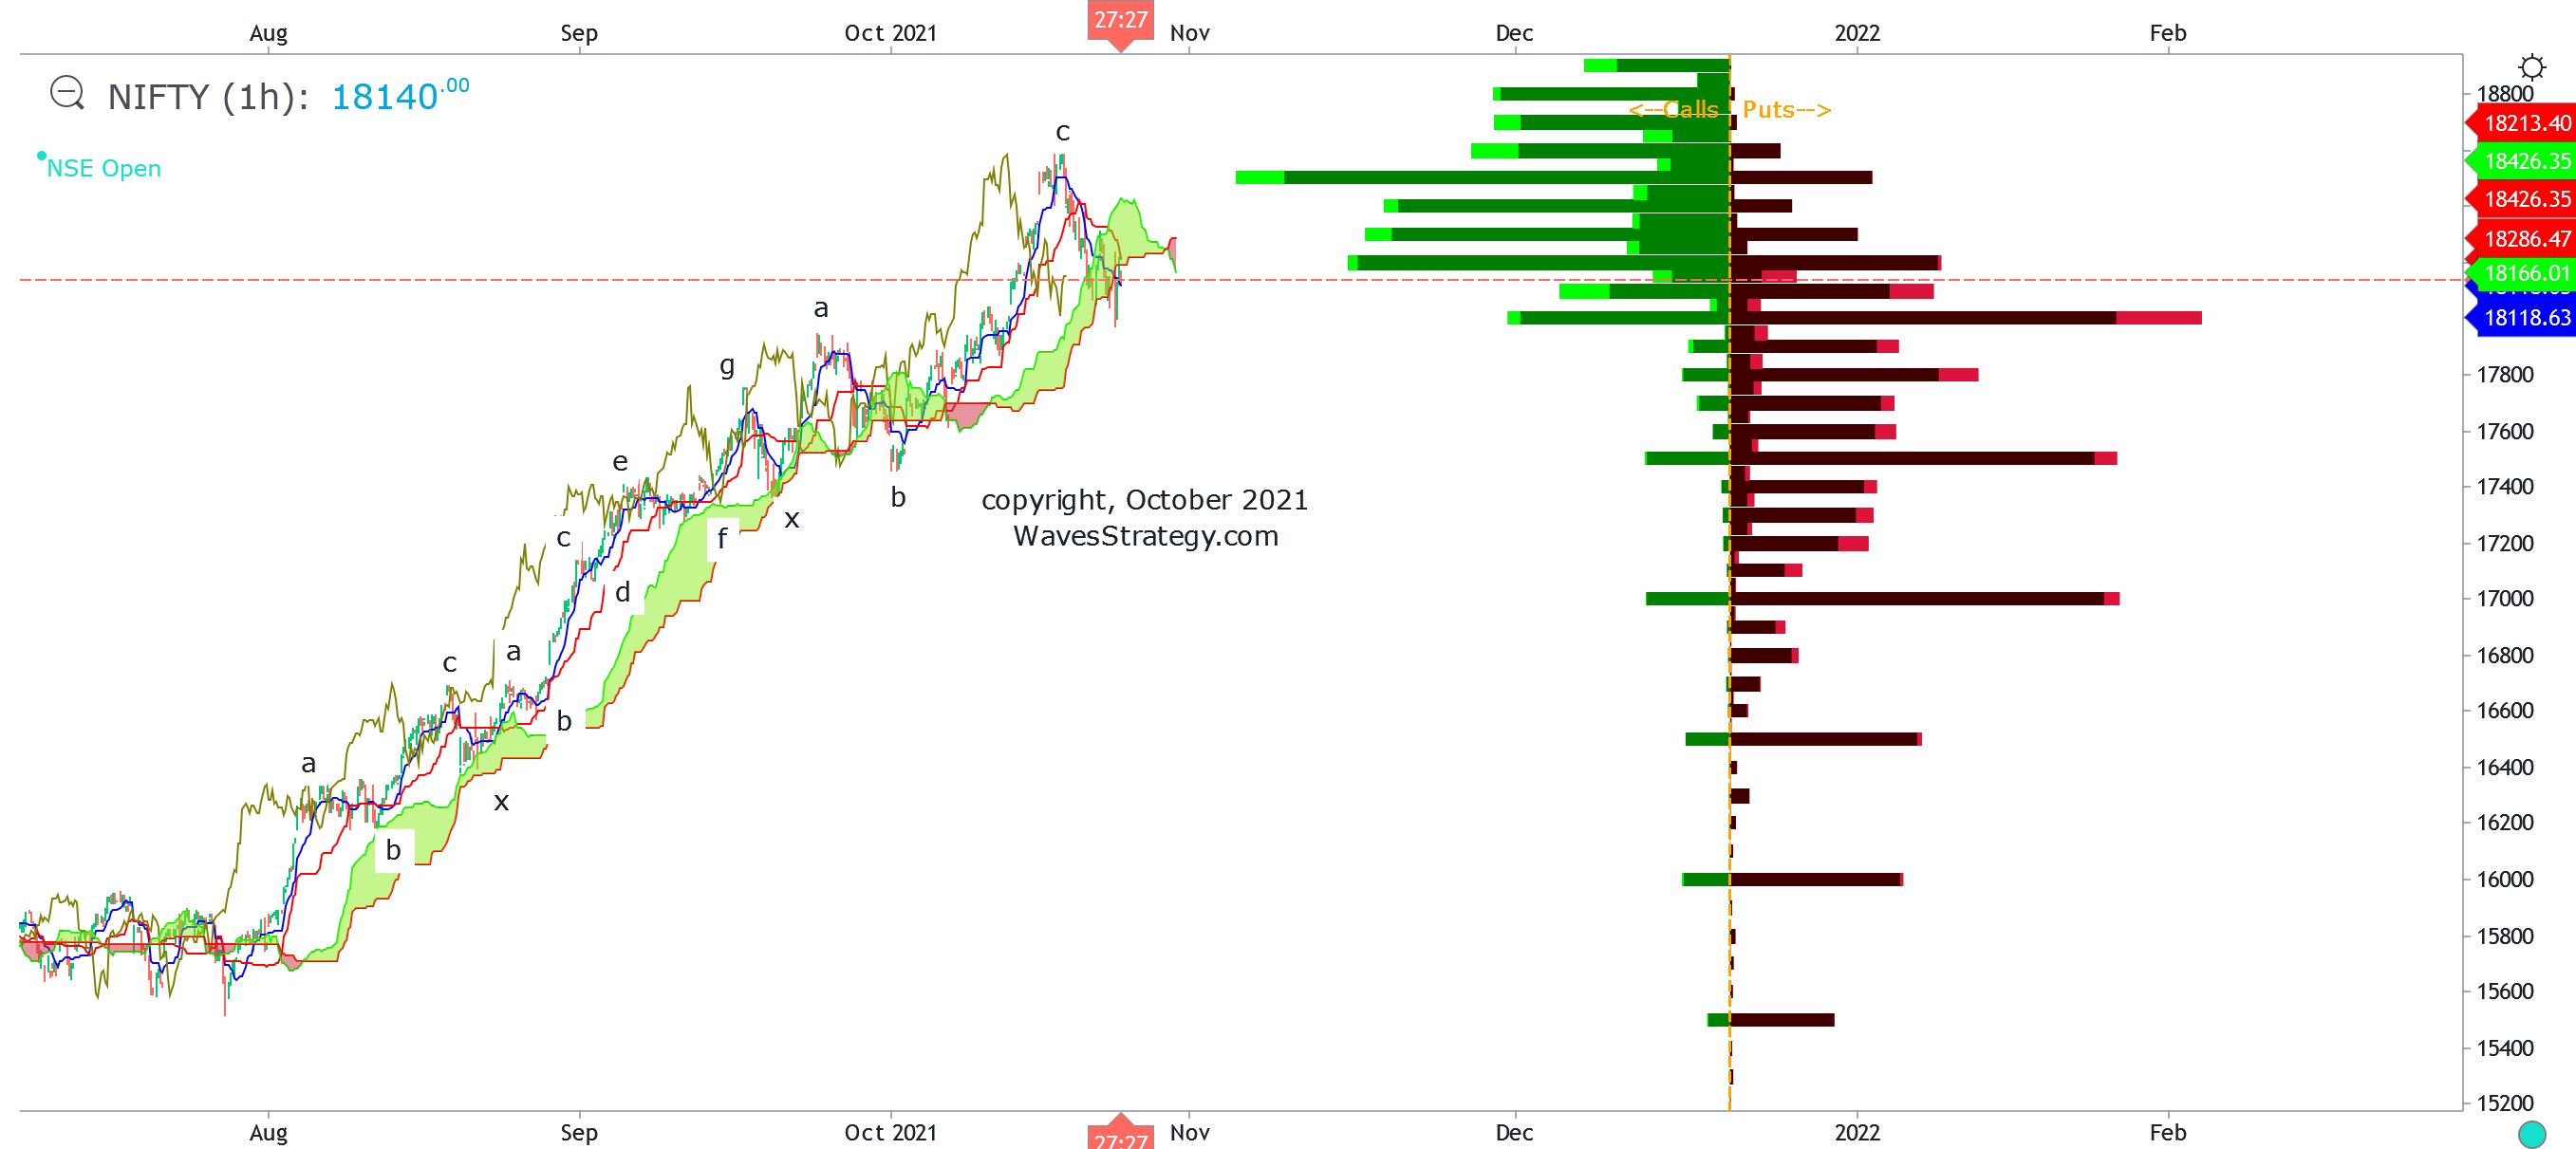
Nifty 60 minutes chart:
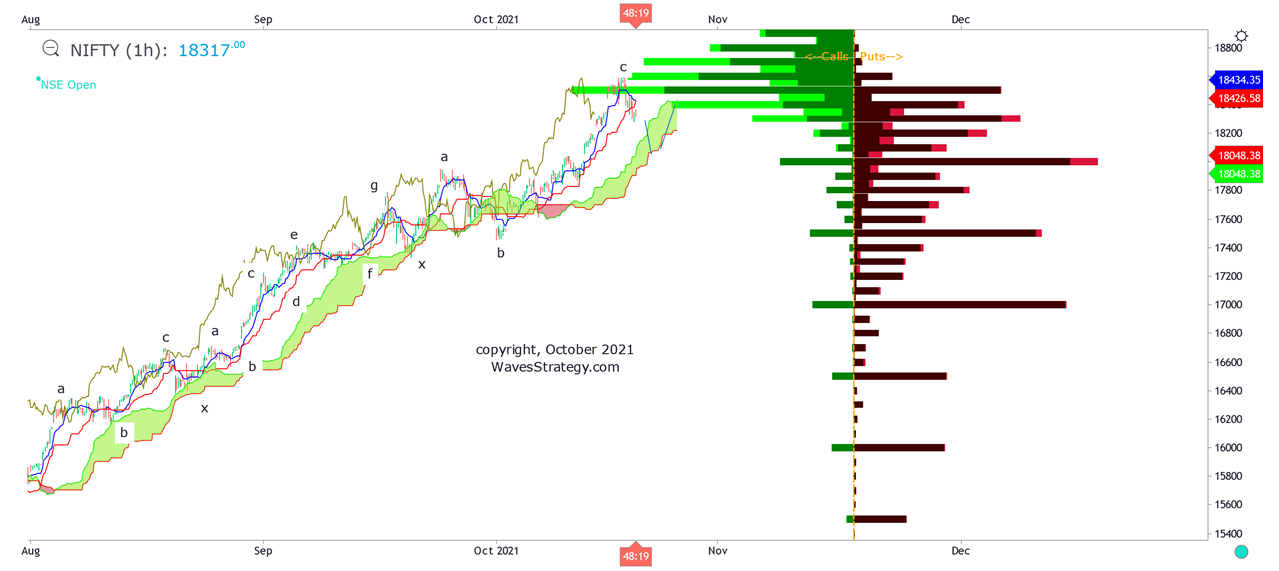
Elliott wave analysis
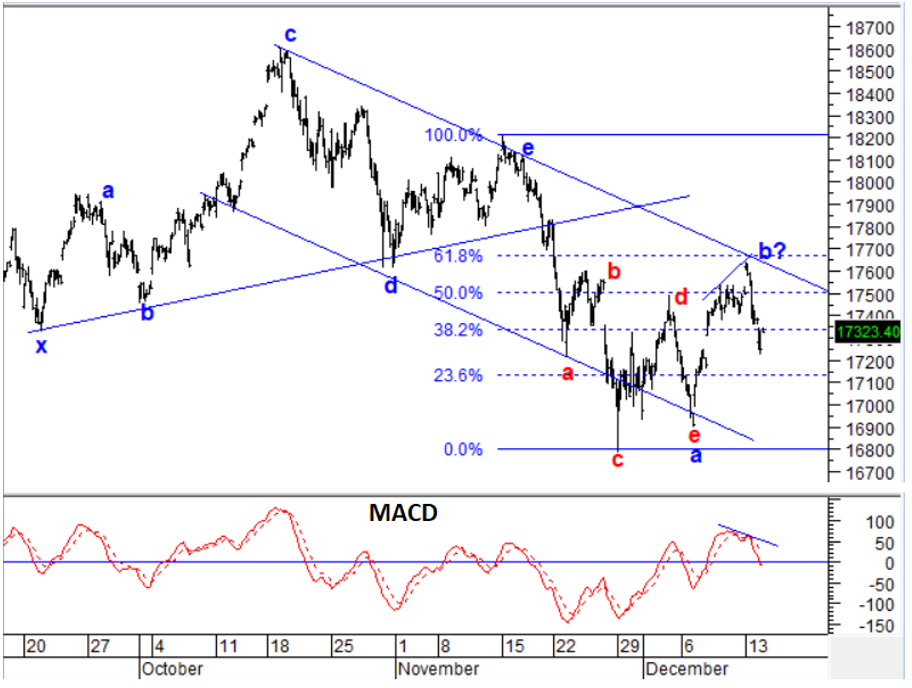
Nifty on a 60 minutes time frame shows after Diametric pattern there was a dip in form of wave x and post that we might be forming a Neutral Triangle pattern or a Diametric again. Currently prices are in wave d of the same after forming a top in form of wave c near 18600 levels.
We are showing the path ahead on Nifty that can dip towards the Ichimoku cloud support and highest OI of Put option which is near 18000 and then there can be pullback on upside. This is also an assumption given the sharp fall of past few hours and rise in OI in call options near 18500 levels.
Open Interest analysis: OI profile chart shown along with prices gives further conviction for identifying key reversal areas. We can see that 18500 is near term resistance as there is high build up in OI for Call options of 18500 strike price and 18000 is highest OI for Put OI. Also 18400 is showing sharp rise in Call OI, so use pullback as shorting opportunity as long as 18400 – 18500 is intact and on downside expecting a move towards 18050 – 18k as per the path shown above. Also note this has to be evaluated as the market progresses and trade on basis of charts and patterns.
The above research clearly showcase how Ichimoku Cloud, Neo wave and OI profile can help in taking a clear trade setup for Option traders and form the strategy accordingly. These are simple yet powerful methods of forecasting and trading the markets.
Subscribe to the Multibagger, Momentum, Nifty / Bank Nifty calls that are derived on basis of these methods directly on WhatsApp / SMS and also get a research report along with it free to enhance your learnings.
Want to ride the momentum for 8% to 10% target with prudent risk reward and clearly defined stoploss – Get access to Momentum calls more here
Nifty / Bank Nifty calls – Want to trade only index on intraday or positional basis – check here
Mentorship on Timing the Markets: Mentorship starts in November that will ensure you become an Expert Trader with clear defined strategy, disciplined approach and science to forecast the markets. Time is the most essential element and we will provide over the period of 3 months all necessary tools required for one to become a profitable trader using Options. For more details Contact us on +919920422202.