Monday, August 30, 2021

Datamatics – 1 Indicator to Ride 17% Move in 2 Days!

Datamatics has shown a sharp rise and exhibited classic Impulse rise as per Elliott Wave.

Many have been trying to enter the stock but we turned bullish just when the 3rd wave resuming up move after the brief consolidation. 

We recently gave DATAMATICS call to our Momentum calls and research subscribers and the stock is up 17% within two days! checkout how we identified this winner.

DATAMATICS daily chart (30th August 2021)

DATAMATICS hourly chart

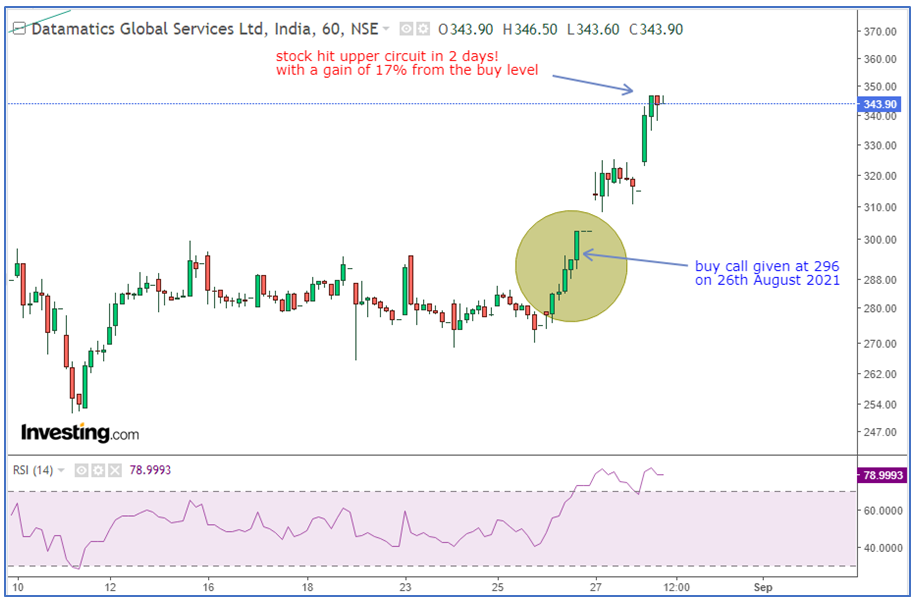
We had given the following call to our momentum clients on 26th August 2021:

MOMENTUM CALL: DATAMATICS BUY ABOVE 296 SL 279 TGT 330

Wave Analysis:

On the daily time frame, we can see that the stock was in an impulse rise and its third wave was unfolding. Wave 3 itself seems to be extended which is often the largest wave in an impulse in terms of price movement. The overall rise since March 2020 was within the rising channel and in Mid-July this year prices broke above the channel and had sustained very well above it. This indicates a sign of bullish strength which was also confirmed by the shift in the range of RSI since May 2021 where it was taking support above 50 levels.

After the stock retested the broken channel trendline recently we drilled down to the hourly time frame where we gave a buy call above 296 levels which was the breakout of a tight consolidation range.

Happened: The call initiated on 26th August and within two days as on now the stock has made a high near 346.50 levels which is a gain of 17%!

Simply imagine one can trade only on the basis of 1 indicator which is Elliott Wave without combining it with any other tools. That is the power of Elliott wave method if one knows the correct application of the same.

Independence Offer Ends in 1 Day- Get access to Momentum calls and research consisting application on charts and how you can ride the trend using simple powerful Wave theory. Independence Offer Ends in 1 day, Act NOW! Subscribe here

Advanced Elliott Wave – Neo Wave and Hurst’s Time Cycles – 5 days to go for the Most Advanced Training on Elliott wave, Neo Wave, Hurst's Time Cycles Ever, Live Event on 4th – 5th September 2021, Time is now to trade with an Edge of wave theory like never before and select your own Momentum, Multibagger stocks using Simple Methods, easy to implement. Fill the form here below for more details

Friday, August 27, 2021

Is Nifty Headed Towards 16840? Why 16580 - 16386 Is Key? 27-08-2021


Is Nifty Headed Towards 16840?

Nifty 16840 is my target level, I am writing put options for these levels. It is working awesome for me so far. See this video.

Are you with me for Master of Waves S2.2, Time the trade right from next few minutes to few days, find option expiry levels, It's on 4 - 5th September 2021. know more

We would love to connect with you on Social Media: Twitter - https://twitter.com/kyalashish/ Instagram - https://www.instagram.com/kyalashish/ Facebook - https://www.facebook.com/AKTradingGurukul Telegram - https://t.me/AKTradingGurukul LinkedIn - https://www.linkedin.com/in/ashishkyal/ ---------------------------- "SEBI “Research Analyst” No: INH000001097 Visit us : https://www.wavesstrategy.com/ Write to us on : helpdesk@wavesstrategy.com Contact us: +91 9920422202

Wednesday, August 25, 2021

Bank Nifty Elliott Wave, Open Interest Anticipated - Happened, BANG ON!

Bank Nifty Elliott Wave pattern is working in lock step fashion as expected and combining it with Fibonacci ratios is giving awesome outcome.

In below research we can see how the pattern was forecasted on basis of Elliott Wave and Open Interest analysis. This was also published in our research articles – here it is for reference.

Bank Nifty Anticipated on 17th August 2021

Bank Nifty shown in Webinar on 21st August 2021

Bank Nifty happened as on 25th August 2021

Elliott Wave analysis

Bank Nifty first chart which was shown on 17th August clearly indicated that after completion of 5 waves on upside we can expect 3 waves correction in the form of a-b-c and the same was seen. Also the Fibonacci ratios are important along with Elliott Wave and the retracement of the entire leg showed that the support is near 61.8% levels once the 38.2% level was breached. We highlighted this in our earlier research and Bank Nifty later formed a low near 34900 levels which was precisely 61.8% retracement levels.

Bank Nifty 2nd chart was shown during my Free webinar on 21st August where we highlighted that there is now possibility of a pullback on upside and once the positive hourly candle closed above the previous high there was confirmation that the trend has reversed exactly from the level and the up move has started. We also mentioned about the upside target levels and Bank Nifty achieved the same.

Happened:  The 3rd chart clearly showed how Bank Nifty behaved on basis of these technique and a trader can trade with high conviction and accuracy by combining Elliott wave with Fibonacci levels.

So, what is next from here for Nifty, Bank Nifty and stocks? Get access to our daily research report and see it yourself. Under Independence Day Offer get at steep discount of 50% on advisory calls and free research access which is available only for limited time. Check here

Elliott Wave, Neo Wave and Hurst’s Time cycles with Ichimoku Cloud – Learn the science of forecasting and trade with an edge. Only if one has the required tools that is working in markets can they trade profitably and with consistency. Trading is a systematic process and can help with generating passive income. Early Bird Ends today – know more

Tuesday, August 24, 2021

What is the difference between Elliott wave and Neo wave? 24-08-2021


Most Advanced Technical Analysis Training Ever - Elliott Wave, Neo Wave, Hurst's Time Cycles and Ichimoku Cloud. Enroll now – https://www.payumoney.com/events/#/buyTickets/MOWOffer

Master of Waves Early offer Ends 25th August, You Get -
- 3 Exclusive Bonus videos for Lifetime
- 15 Days of Equity research report
- 6 Hours of Elliott Wave video links
- Live Pass to 4th - 5th September 12 Hours of Elliott Wave, Neo Wave, Time Cycles, Ichimoku
For any query contact us on +919920422202
---------------------------------------------------
We would love to connect with you on Social Media:
---------------------------------------------------

Friday, August 20, 2021

Nifty Divergence with Volumes, Bank Nifty - Check in this Video! 20-08-2021


Nifty Volumes are faltering with every rise and Bank Nifty is failing miserably. You can still trade this market on basis of the support and resistance levels.
More research at - https://www.wavesstrategy.com/blog Contact: +919920422202

We would love to connect with you on Social Media: Twitter - https://twitter.com/kyalashish/ Instagram - https://www.instagram.com/kyalashish/ Facebook - https://www.facebook.com/AKTradingGurukul Telegram - https://t.me/AKTradingGurukul LinkedIn - https://www.linkedin.com/in/ashishkyal/ -------------------------------------------------------------------------------------------------------------- "SEBI “Research Analyst” No: INH000001097 Visit us : https://www.wavesstrategy.com/ Write to us on : helpdesk@wavesstrategy.com Contact us: +91 9920422202

Wednesday, August 18, 2021

Multibagger Stock – Why Infosys is Up 80% In A Year!


We had recommended to buy #Infosys in our #Multibaggerstock report back in July 2020 around 870-960 levels! See detailed chart and analysis that the stock followed here- https://www.wavesstrategy.com/blog/Infosys

More research at - https://www.wavesstrategy.com/blog Contact: +919920422202

We would love to connect with you on Social Media: Twitter - https://twitter.com/kyalashish/ Instagram - https://www.instagram.com/kyalashish/ Facebook - https://www.facebook.com/AKTradingGurukul Telegram - https://t.me/AKTradingGurukul LinkedIn - https://www.linkedin.com/in/ashishkyal/ -------------------------------------------------------------------------------------------------------------- "SEBI “Research Analyst” No: INH000001097 Visit us : https://www.wavesstrategy.com/ Write to us on : helpdesk@wavesstrategy.com Contact us: +91 9920422202

Friday, August 13, 2021

Nifty Intraday Trading, How To Make Money in 3 Steps!

Nifty has moved from 15900 to the targets of 16480 we have been talking since the past few days.

Daily morning research reports have talked about these levels on the basis of Simple Technical Analysis methods.

See the below chart that we used in addition to Elliott Wave analysis to give to our advisory clients

Nifty Hourly Chart:

The 3 main steps based on which we generate calls are as follows:

Step 1: We first identify the Elliott wave patterns and then use the Fibonacci projection to derive the targets in confluence with the Time Cycle.

Step 2: We then identify reversal areas based on price action and Bollinger bands on the lower time frames for refined early entry in the trade or Breakout strategy

Step 3: The last step is to check if there is enough room for price to move based on the overbought/oversold conditions of RSI and price action support and resistance zones.

A combination of these three steps help us to identify winning intraday trades in Nifty which we give to our Nifty intraday call subscribers.

Target achieved in below calls:

02-08-2021 NIFTY FUT BUY ABOVE 15925 SL 15845 TGT1 15985 TGT2 16050

03-08-2021 NIFTY AUG FUT BUY ABOVE 15960 SL 14880 TGT1 16030 TGT2 16100

05-08-2021 NIFTY FUT BUY ABOVE 16305 SL 16235 TGT1 16370 TGT2 16450

11-08-2021 NIFTY FUT BUY ABOVE 16270 SL 16180 TGT1 16360 TGT2 16450

Get access to Intraday / Positional calls directly on WhatsApp / SMS and receive research report free along with it “The Financial Waves Short Term Update” that contains view on Nifty and stocks that can provide trading opportunity. Subscribe Here

I will be addressing today at 7 in the free webinar how to Trade Intraday from here and if Bank Nifty can move to 37000 - Register here

Take the step towards becoming a successful trader and trust me it is Simple and I will personally help you to take trade using Elliott wave in a way that you cannot miss learning it.  Know more

Thursday, August 12, 2021

Nifty and FII / FPI Correlation, Is it A Myth?

 Many believe that FII / FPI are the main reasons why the markets move higher or lower. Let us take a step forward and analyse it objectively if that is the case always!

We are showing FPI Investments along with the Nifty movement, but a close look will show that there have been many instances that the Nifty movement has been independent whether the FIIs are pumping in money or not. See the below chart:

FII Data with Nifty Plot

Chart source: equityfriend.com

In the above chart we have highlighted the areas where FIIs were net sellers and still market continued to move sharply higher. Also, prior to crash of March 2020 they have been net buyers in subsequent prior months. It was only in March 2020 that their selling was along with fall in the markets. It is very obvious that when big money moves in or moves out markets will move due to their buying or selling. But do understand it does not carry any forecasting ability that if FII’s have bought in a month the next month is going to be positive. This is incorrect way and does not help a trader to take a stand.

On, past instances as well we can see the Nifty has continued to move higher even when there was subdued activity by FIIs during the year 2016, 2017 and the year 2019 was majority of the times sideways despite lot of buying by FII’s.

In a nutshell FII’s do not give any early signal that we expect markets to rally or fall else they would have been net buyers all through the months prior to March 2020. The chart infact reflects that they are behaving like every other market participant and do miss out on trends like in this year and do get stuck like in March 2020.

So, how can one trade if FII’s data does not provide any objective reason for one to buy or sell. It is important to see the patterns and those are in form of Elliott wave / Neo wave that carries forecasting ability. See below chart of Nifty Neo wave and by understanding the pattern one can predict what is going to happen next.

Below is Nifty Neo Plot and Path Ahead

Above chart shows different patterns forming as the market is moving higher. Interestingly each of the pattern is moving in equality and we can clearly see that from the above plot. This gives a possible target of near 16480 levels and how prices can behave in the month of August.

Power of Forecasting: It is only when we can forecast the market behaviour can we form Option trading strategy accordingly. By knowing the FII’s data is like any other indicator that can increase the conviction but nothing more. Nifty path is shown in above chart and we will see how it behaves going forward from here on. Stay tuned!

Elliott Wave / Neo Wave and Hurst’s Time Cycles – Equip with the tools and learn the above simple methods of forecasting and trading using patterns of wave theory. Join us on 4th – 5th September Online Event on Master of Waves (MOW) Season 2.2, Only limited seats, Act Now, more over here

Subscribe to the Nifty / Stocks advisory calls and get research reports free along with it that can give you an edge on trading. Visit the Pricing page here

I will be explaining Nifty Neo wave plot mentioned in the above article in much detail tomorrow at 4pm, Are you ready for learning this simple and amazing method – Book your seat now

Tuesday, August 10, 2021

Why Bharti Airtel Is Up 5% Today? How to Trade Momentum?

Why Bharti Airtel Is Up 5% Today? How to Trade Momentum?: Bharti Airtel continued to rise sharply and is up by more than 8% since we published our research. Many are focused on the news, but trade the charts not news.


Bharti Airtel has continued to rise sharply and is up by more than 8% since we published our earlier article on this stock on 3rd August 2021- You can again read it here – Nifty at 16K, Stocks to Trade?

The stock has continued to move up and many are focused on the news, but the charts could have helped to take the trade rather than the news or events:
More research at - https://www.wavesstrategy.com/blog Contact: +919920422202

We would love to connect with you on Social Media: Twitter - https://twitter.com/kyalashish/ Instagram - https://www.instagram.com/kyalashish/ Facebook - https://www.facebook.com/AKTradingGurukul Telegram - https://t.me/AKTradingGurukul LinkedIn - https://www.linkedin.com/in/ashishkyal/ -------------------------------------------------------------------------------------------------------------- "SEBI “Research Analyst” No: INH000001097 Visit us : https://www.wavesstrategy.com/ Write to us on : helpdesk@wavesstrategy.com Contact us: +91 9920422202

Should you invest in IPO? Tips & Things to Know


An IPO can be your opening to a quick profit in a short time. IPO can also help you in growing your wealth over a prolonged period. Tips & Things to Know before investing. More research at - https://www.wavesstrategy.com/blog Contact: +919920422202

We would love to connect with you on Social Media: Twitter - https://twitter.com/kyalashish/ Instagram - https://www.instagram.com/kyalashish/ Facebook - https://www.facebook.com/AKTradingGurukul Telegram - https://t.me/AKTradingGurukul LinkedIn - https://www.linkedin.com/in/ashishkyal/ -------------------------------------------------------------------------------------------------------------- "SEBI “Research Analyst” No: INH000001097 Visit us : https://www.wavesstrategy.com/ Write to us on : helpdesk@wavesstrategy.com Contact us: +91 9920422202

Monday, August 9, 2021

Vodafone Idea – Will it Reclaim 10 Levels?

Vodafone Idea had been a disaster for the majority of the traders or investors. The stock crashed by more than 40% after the exit of Kumar Mangalam Birla. Now the question is - Will it recover back to its lost glory?

Look at the chart of Vodafone over here

Vodafone Idea Daily chart

The daily chart of Vodafone has formed a morning star candle pattern which is a three-candle bullish reversal pattern and prices closed back above the lower Bollinger Bands. Also, the daily RSI had reached deep oversold levels when the low of this candle pattern formed and so we found a short term bounce back from below 5 levels. But the point is as the overall trend of the stock is negative any pullback is going to be short lived.

Many are waiting for it to reclaim its levels of 10 but we have our doubts. Following is the reasoning for the same -

If we observe the trend of this stock, it can be clearly seen going from top left of the chart to the bottom right. This indicates that over the medium term the overall trend is on the downside. Important resistance is placed near 8.90 levels on the upside. Hence the pullbacks can be short lived and the down trend may resume soon.

In a nutshell, it is best to be out of this stock on pullback towards 8 levels as from the same we can expect a reversal back on the downside towards the level of 5.50 – 5 zone. It is best to invest in stocks where there is potential to outperform and not get stuck in such stocks which is not only financially painful but will consume a lot of emotional energy as well.

Which stocks to buy that can show short term Momentum? Get access to the Momentum or Multibagger research to find out stocks that can help you ride the current Bull trend! Know more here

Most Advanced Technical Analysis Training – Elliott Wave / Neo Wave, Timing the market using Cycle analysis are must tools for anyone wants to time the market to the very Week, Day, or Hour! 2 Days of Online Event, Limited Seats only, know more here

Tuesday, August 3, 2021

Nifty at 16K, Stocks to Trade?

 Nifty is trading near 16k levels and Bharti Airtel is expected to announce its quarterly earnings today. Let us see what the technical charts suggests could be the outcome!

Bharti Airtel (daily chart as of 03-08-2021)


On the daily chart of Bharti Airtel, we can see that since mid-October 2020 the stock was in a strong uptrend all the way till early February 2021. After February there was a long consolidation in prices which formed a triangle pattern. It can be clearly seen that the highest volume profile area is near 526 levels where the stock was accumulated over the months and has now started moving higher.

After completion of E leg of the symmetric triangle pattern which is a continuation pattern the stock gave a bullish breakout on 22nd July 2021. Usually, the pattern target is the height of the first leg I.e. A projected from the bottom of E leg. The pattern target comes up to 648 levels. Important support is placed near 520 levels.

All these technical signals combined suggest that the earnings outcome could most probably be on the positive side and the news can act as a catalyst to push prices higher.

Do you know the correct way to apply Indicators that can sky rocket your accuracy? Now you have the opportunity to learn these simple powerful techniques from Ashish Kyal, Author (International Book), CMT – USA in upcoming training on 7-8th August Master of Technical Analysis Season 2.2 (MOTA S2.2). Only 4 Days to go!! Act now Register here

Monday, August 2, 2021

Bank Nifty Ichimoku Cloud, Elliott Wave Pattern

Bank Nifty has continued to be a major laggard in the ongoing market rally. This index formed a top in February 2021 and is still far away from that.

Ichimoku Cloud and Elliott Wave is a simple and powerful way of forecasting and trading the markets.

Following research is published in the morning research report The Financial Waves Short term update”

Bank Nifty daily chart:

Ichimoku Cloud is a simple indicator that helps to understand the key support, resistance level and the overall trend for the stock or index. We can clearly see that the index has been failing to show any upside momentum even when Nifty is trading near lifetime high levels. This underperformance from Bank Nifty is concerning but we have to wait and watch if it can start to catch up on the upside or start giving away by breaking below the lower end of the cloud support.

Elliott Wave pattern: As per the Elliott wave pattern prices are moving in the form of wave (c) and the entire rise is non – impulsive. There is possibility that the entire move is in form of Big triangle. Support is near 34000 and the upper end of resistance at 36000 mark.

So, by combining these two techniques how can we trade?

As we can see prices are near the cloud support and move back above 35000 will indicate short term upside pullback towards the previous high whereas a break below the support will indicate a no trading zone as prices will be stuck within the cloud with support near 33900 levels. So conviction to take trades increases sharply by combining both Elliott wave and Ichimoku Cloud.

Subscribe to the Daily equity research report – The Financial Waves Short Term Update and get insight into Nifty, Bank Nifty, Stocks that are providing good opportunity and much more. Get access now to be on the right side of the trend over here

Want to Trade with High Conviction, No Anxiety, Riding the Trend, Stock identification and a Clear Plan & Trade Strategy? Become Market Wizard – BMW Season 2.2 starting this Saturday on 7th August – 8th August will ensure you are equipped with tools to make it BIG by trading with complete strategy. Learn from Author, CMT, Mentor Ashish Kyal and you will be thrilled to see how amazing one can predict the markets by combining simple and powerful tools, It does not matter if you are just starting or already an expert trader, timing the market using Time Cycles, Elliott Wave and Patterns is must tool for everyone, Limited Seats only, Registrations closing soon, know more here