Showing posts with label ichimoku cloud. Show all posts

Monday, June 12, 2023

Nifty 15 Minutes Time cycle – Trading Ichimoku Cloud

 Is it possible to Time the market for Trading?

Yes – Time cycle is scientific approach to identify the possible reversal and can help Options Traders to Time the market.

Price action techniques if combined with Time cycles one can trade exceptionally well with high accuracy.

Nifty 15 minutes chart: 43 period Time cycle

Nifty 43 period Time cycle on 15 minutes chart is plotted above. The vertical lines are the zone of Time cycle from where we can see short term upside reversals.

On most of the occasions prices have showed pullback or upside move after it has come within the zone of red and blue vertical lines. This lines are placed every 43 candles.

It means that after every 43 candles prices have tendency to move on upside. This if clubbed along with price action technique can provide complete trade setup.

Ichimoku Cloud – This is price focused indicator and provide complete insight into support, resistance, trend of the market. When prices move from below the cloud (highlighted green and red color) back above it we can see upside thrust form time cycle zones.

Currently prices are below the cloud and so from Time cycle zone we are seeing only minor pullback, but if prices reaches the time cycle area when it is above the cloud we get strong trend on upside.

In a nutshell, prices need to break back above the cloud resistance near 18640 and then when it approaches Time cycle vertical line it will provide classic opportunity to go long again. This concept of Time can be applied not only on 15 minutes chart but also on daily, weekly and monthly charts for Investment purpose.

Master of Cycles – Timing the market to very Day, Hour and Minute by combining this concept of Time trading along with KST indicator and Ichimoku Cloud. Online session on 24th – 25th June 2023 along with followup session. Limited seats only, Register now over here

Mentorship on Trading - Above chart simply shows how price action along with Time cycle and Neo wave can be combined. A Mentor can ensure that proper application of these methods is passed across so that it can form a powerful system to generate that parallel source of income. Be a part of Elite traders community we call as #TimeTraders. Know more here.

Wednesday, May 24, 2023

How to catch Momentum using Ichimoku cloud and price pattern

It is possible to capture good moves in stocks using price patterns along with simple indicators like ichimoku cloud. See how we identified such move in SHREDIGCEM.

Ichimoku cloud - The Ichimoku Cloud is a technical tool that indicate the support and resistance, identifies trend direction, gauges momentum and provides trading signals

The Following research is picked up from our daily Equity Research Report which our subscribers receive pre-market every day.

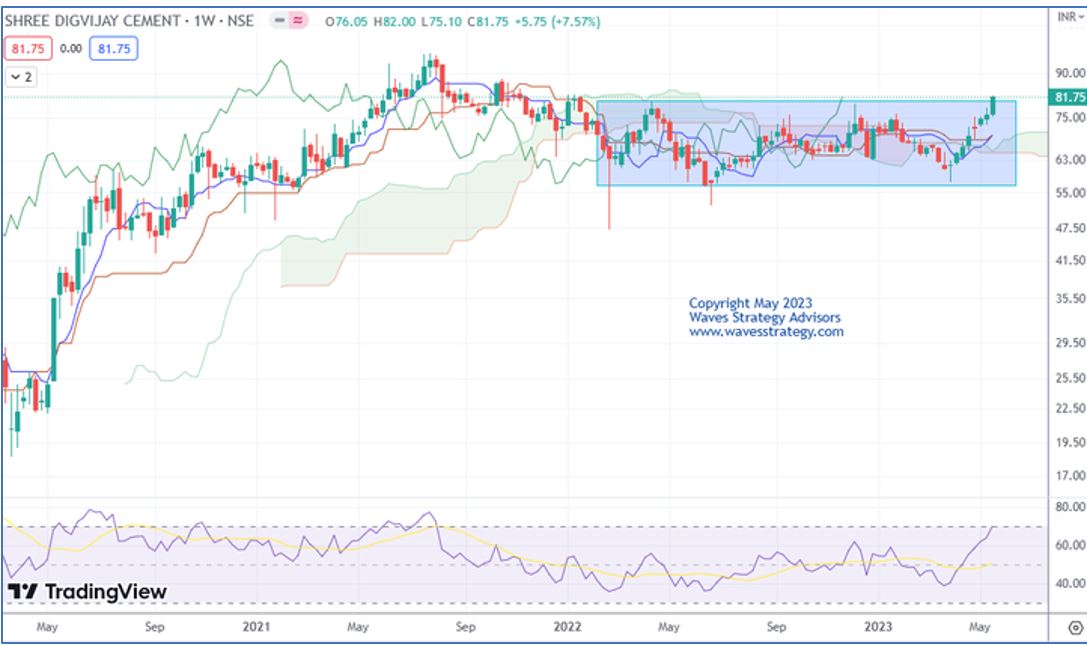
SHREDIGCEM Daily chart as on 22nd May 2023


SHREDIGCEM 60 mins chart as on 22nd May 2023

Wave analysis as published on 22nd May 2023

SHREDIGCEM has been moving higher recently and intact in strong uptrend. In the previous session it closed with a massive gain of 5.14%.

On the weekly chart, in the previous session prices formed a bullish candle. Price has been moving in a rectangular range over the last few days indicating accumulation in the stock. In the previous session prices manages to close above this trading range which has resulted in a bullish breakout of the rectangular pattern. Price is trading above the ichimoku cloud which indicate that the short-term bias is bullish.

As shown on the hourly chart, 70-day period Exponential Moving Average is acting as a brilliant support line and it has provided support at regular intervals. This suggest that one should be in the direction of the ongoing trend as far as this line is protected. Closest support is placed at 77.

In short, trend for this stock is positive. Use dips towards 80-81 as a buying opportunity for a move towards 89-90 levels as long as 77 holds on the downside.

Happened

As we expected stock after a dip witnessed a good rally of more than 5% in just 2 trading sessions. Stock made high of 86.50 and it has potential to achieved our target of 89-90 levels in coming sessions.

If we combine simple price action with price patterns then it together works like magic!!

3 Months of Mentorship on Timing the Market – Above chart simply shows how price action along with Time cycle and Neo wave can be combined. A Mentor can ensure that proper application of these methods is passed across so that it can form a powerful system to generate that parallel source of income.

Tuesday, May 23, 2023

Bank Nifty Path Ahead using ADX and Ichimoku Cloud

Banknifty has been moving precisely as per neo wave count. Checkout this example of how we applied ADX and Ichimoku cloud with Price Action to identify the wave counts and predict the price movement.

Following research is picked up from daily equity research report – The Financial Waves short term update

Bank Nifty Daily chart

Bank Nifty 60 mins chart

Wave analysis:

In the previous session, on the daily chart prices formed neutral candle. We can see that Index is consolidating in a range of 43500-44150. Any breakout of the range is needed to understand a bigger picture. ADX is trading at 21 suggesting lack of trending move and giving us hints of range bound action.

On the hourly chart, we have applied Ichimoku cloud. Wherein we can see that prices have just given a close above the cloud which is a positive sign. However, confirmation is still pending for which we need follow up action.  Along with this, MACD is showing positive crossover but further price action is required to confirm the same. Overall indicators are giving us hints of possible up move. Any move above 44150 can confirm completion of wave (b) on the downside and then the up move will be in form wave (c).

In short, Bank Nifty is trading in between a range of 43500-44150. A break above 44150 can lift the price higher towards 44500. Whereas any move below 43500 can drag price lower towards 43150.

3 Months of Mentorship on Timing the Market – Above chart simply shows how price action along with Time cycle and Neo wave can be combined. A Mentor can ensure that proper application of these methods is passed across so that it can form a powerful system to generate that parallel source of income. Be a part of Elite traders community we call as #TimeTraders.

Monday, May 22, 2023

Nifty Using Ichimoku cloud, MACD and Neo Wave Pattern

 Elliott wave and Neo wave are powerful technical analysis methods that can help traders with the complete setup right from Intraday to positional trades.

Below shows Nifty Neo wave count along with Ichimoku Cloud and MACD. This research is picked up from the daily Equity research report. “The Financial Waves short term updatewhich was published today before market opens

Nifty Daily chart

Nifty 60 mins chart

In the previous session, after opening with a minor gap up, prices could not sustain higher and sharp fall was witnessed which led prices to make low of 18060.40.

On the daily chart, The Nifty50 has snapped a three-day losing streak and closed on a positive note. Nifty managed to close above 18200 mark and formed a hammer type candle on the daily charts. Price has bounced back from the major support of 18060 and since then short covering was seen which led prices to close above 18200 mark near day’s high. Prices have bounced back on the upside by taking support of the base line. 

On an hourly chart, prices have moved up precisely by taking support of the channel which is a positive sign. Simple channelling techniques works well! Also, MACD has shown a positive crossover giving us hints of further possible up move. We need decisive break above 18300 for fresh buying to emerge.

As per wave perspective, prices are moving in Diametric pattern and as per neo wave prices completed wave (c) at the top and now wave (d) is moving on the downside. Any breach above 18300 can confirm the completion of (d) on the downside and then the rise will be in the form of wave (e).

In short, Nifty has snapped a three-day losing streak and closed on a positive note. For now, any breach below 18060 can drag the price lower till 17960. Whereas any breach above 18300 is needed for the fresh buying to emerge which can take prices higher 18400.

3 Months of Mentorship on Timing the Market – Above chart simply shows how price action along with Time cycle and Neo wave can be combined. A Mentor can ensure that proper application of these methods is passed across so that it can form a powerful system to generate that parallel source of income. Be a part of Elite traders community we call as #TimeTraders.