How to use Price Action with Indicators for analysing stocks
Simple strategies like price patterns can be combined with Ichimoku Cloud to achieve powerful results. Check out how we selected ZENTEC which has rallied more than 19% within short span of time.
Ichimoku cloud - The Ichimoku Cloud is a technical tool that indicate the support and resistance, identifies trend direction, gauges momentum and provides trading signals.
We published the following research on ZENTEC pre-market on 16th February 2023 in "The Financial Waves Short Term Update” which our subscribers receive pre-market every day.
ZENTEC Weekly chart as on 16th February 2023 (Anticipated)

ZENTEC Weekly chart as on 28th February 2023 (Happened)

Wave analysis as published on 16th February 2023
ZENTEC has been moving higher recently and intact in strong uptrend. In the previous session it closed with a massive gain of 10.13%.
On the Weekly chart, in the previous session prices formed a bullish candle. A weekly close above 227 level will confirm breakout of the rounding bottom pattern. Price is trading above the ichimoku cloud which indicate that the short-term bias is bullish.
In short, trend for this stock is positive. Use dips towards 193-196 as buying opportunity for a move towards 215-220 levels as long as 187 holds on the downside.
Happened: Stock moved precisely as expected. The price took support near the neckline and after a dip, a good rally was witnessed. Even though market was down the stock has gained more than 19% from the dip levels and made high near 274 levels within short span of time.
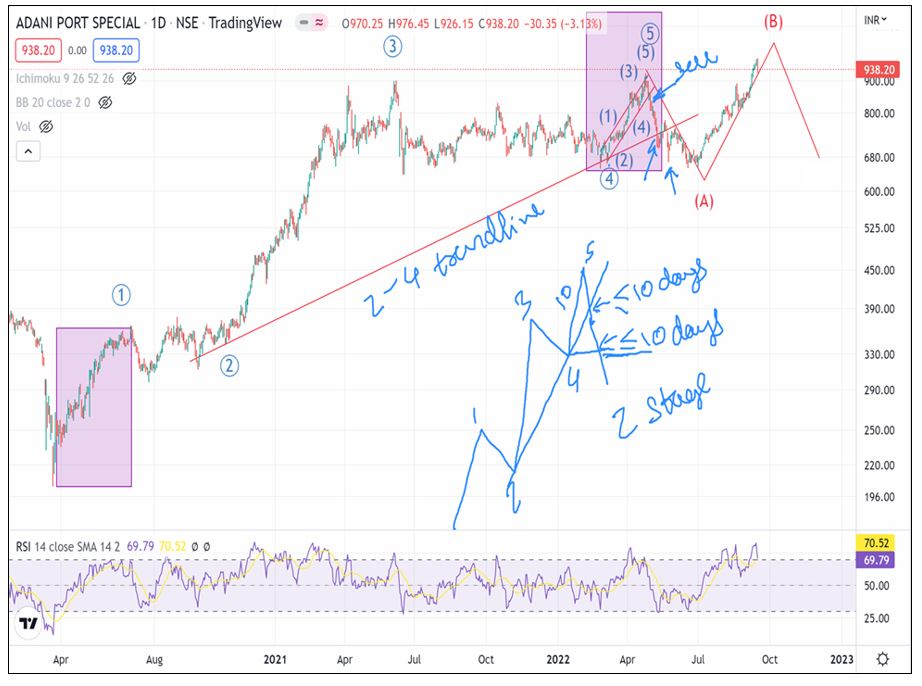
3 Months of Mentorship on Timing the Market – Above chart simply shows how price action along with Time cycle and Neo wave can be combined. A Mentor can ensure that proper application of these methods is passed across so that it can form a powerful system to generate that parallel source of income. Be a part of Elite traders community we call as #TimeTraders. Early Bird ends on 28th February 2023.