Friday, September 30, 2022

Nifty Trading using Gann sq of 9 and Lunar cycle


Nifty why Gann 17227, Gap 17290 major hurdle for prices, how to trade in coming week combining with price action, see in this video.

Stock Market Trading using CandleSticks & Time cycle on 02nd October, Sunday at 11am. Trade setups using the scientific and objective approach to stock markets by Stock market expert Ashish Kyal. Register here  Contact +919920422202

We would love to connect with you on Social Media:


----------------------------
"SEBI “Research Analyst” No: INH000001097
Write to us on : helpdesk@wavesstrategy.com 
Contact us: +91 9920422202 


Thursday, September 29, 2022

Exclusive Invite - Trading using Candlesticks + Time on 02nd Oct at 11am


Stock Market Trading using CandleSticks & Time cycle on 02nd October, Sunday at 11am. Trade setups using the scientific and objective approach to stock markets by Stock market expert Ashish Kyal. Register here  Contact +919920422202

We would love to connect with you on Social Media:


----------------------------
"SEBI “Research Analyst” No: INH000001097
Write to us on : helpdesk@wavesstrategy.com 
Contact us: +91 9920422202 


Wednesday, September 28, 2022

Nifty crashed, What is Next? By Ashish Kyal, CMT | Trading


Time is the essence in the current market scenario and this can Transform your trading journey | Ashish Kyal, CMT Stock Market Trading Simplified from Ashish Kyal Trading Gurukul. Free Webinar - Trade F&O using Candlesticks & Time cycle on 02nd October, Sunday from 11am to 1pm. Register here-
-----------------------------------------------------------------------------------

We would love to connect with you on Social Media:


----------------------------
"SEBI “Research Analyst” No: INH000001097
Write to us on : helpdesk@wavesstrategy.com 
Contact us: +91 9920422202 

Tuesday, September 27, 2022

Nifty Lunar Cycle – Amavasya on 25th September – Markets Crashed!

Lunar Cycle – phases of moon does have impact on the markets. We can clearly see by looking at the index movement with respect to Amavasya (New moon) and Pournima (Full moon). Nifty has been forming tops and bottoms as per Lunar cycle we have talked about multiple times.

Lunar cycle is comprised of 28 – 29 Days which is further divided into two parts – Full moon or Pournima and New moon or Amavasya.
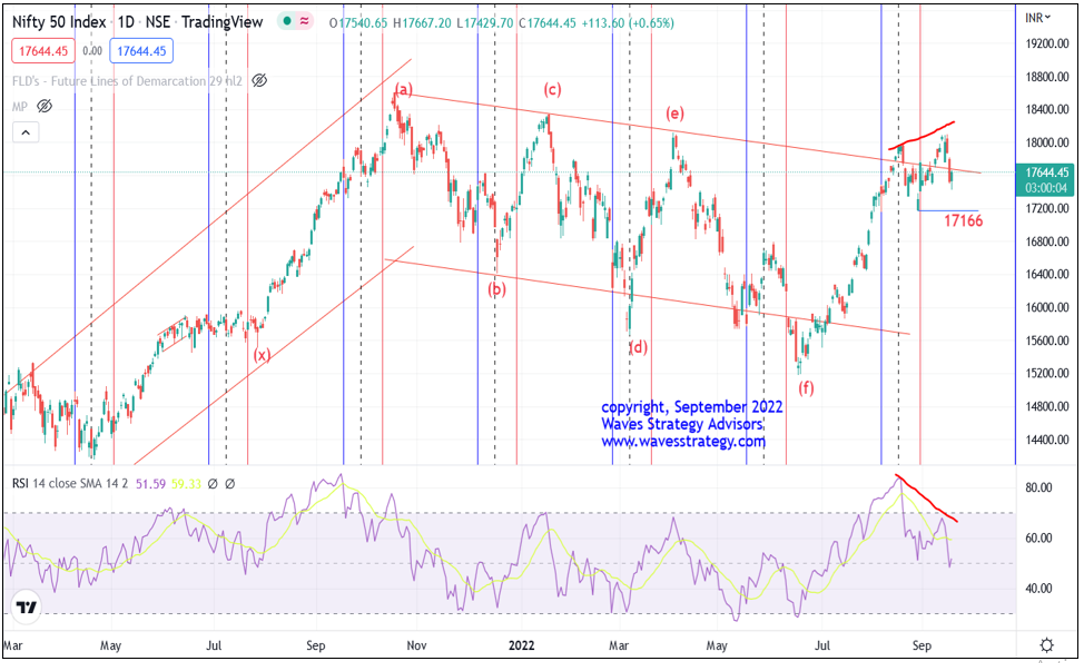
Nifty Lunar Cycle:

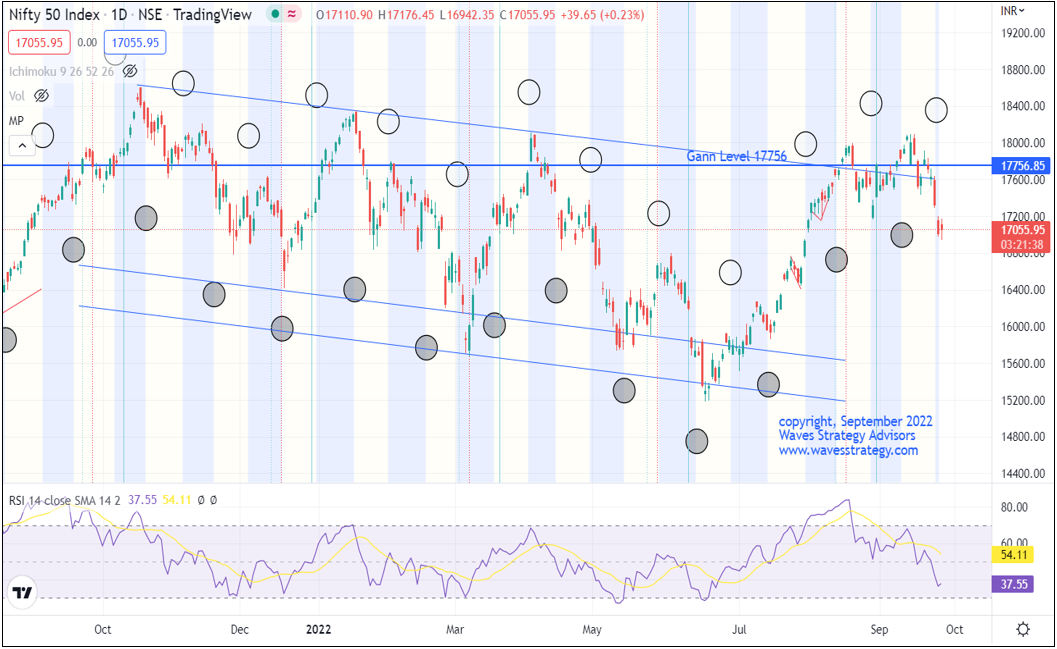
Since the top of 18600 Nifty has formed a top everytime near the Full moon or Pournima. We can see this by seeing the lower highlighted circle that represents full moon.

However, during the recent rise since August 2022 - Full moon 10th August and on 8th September 2022, Nifty formed lows and rallied on upside for 5 days. So, there is change in relationship.

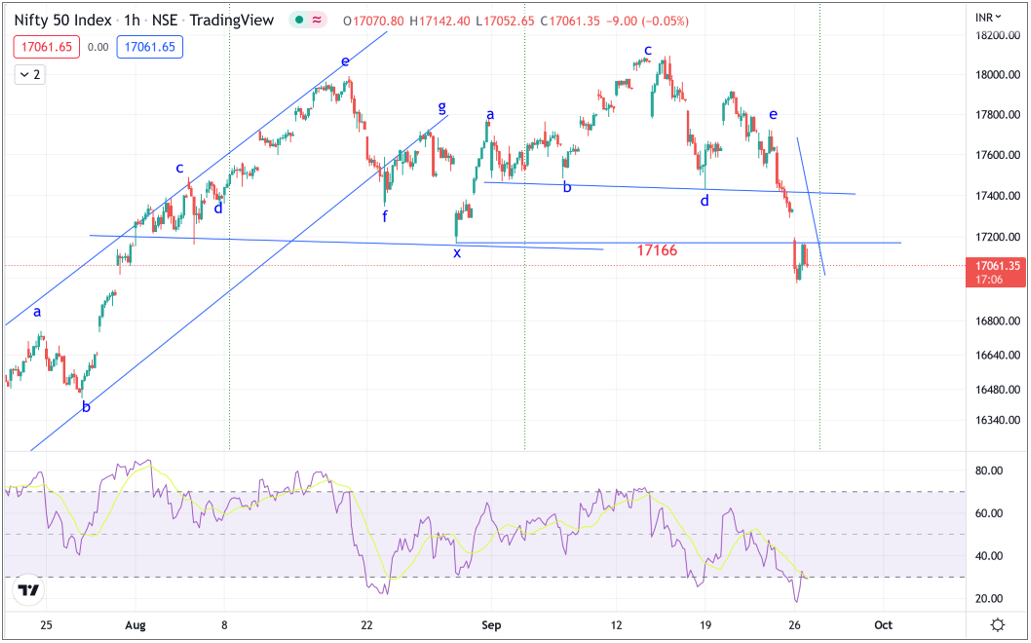
Amavasya or No moon – has usually resulted into non trend or sideways action on many occasions. The recent no moon was on 25th September 2022. We can see a sharp fall from there. So, given that Full moon is now acting to be positive for markets there is possibility that New moon or Amavasya will act bearish. Do note that the effect lasts for 3 to 5  days. Post Amavasya this time prices have already shown sharp correction.

So, there is high possibility as per this cycle Nifty will not cross above the high made near 17600 before the New moon for next 2 to 3 days.

This is vital information for Weekly Option traders. Do note that Lunar cycle can change fast and one has to combine this cyclical technique along with Candlestick methods to make the most out of it.

Time is supreme and is responsible for price movement. By simply combining Time component a trader can form amazing Option Trading strategy.

Mentorship on Timing the markets – Learn the science of Trading the market, stock selection, Option strategy, Time Cycles, Elliott wave, Neo wave and much more in 3 months of Mentorship that is starting on November 2022. Complete handholding with access to private telegram group. Time is now to act. Limited seats only, Fill below form here for more details - https://www.wavesstrategy.com/mentorship/

Monday, September 26, 2022

Nifty Crashed, Traders were Warned near 18k levels!

Nifty crashed from 18k to below 17k levels and enough warning was given in our daily equity research and also following chart was published on 19th September 2022.

Traders were warned about upcoming reversal in Indian equity markets on basis of Time Cycles and we can now see Nifty even breaking below 17166 support and going below 17k levels.

Nifty daily chart (as on 19th September 2022)

Happened: Nifty hourly chart

Following was flagged on 14th September when Nifty was reversing from near 18091 – Twitter @kyalashish

Over past few weeks we have been warning our subscribers and readers that the up move can be a trap and warned on 14th September and again on 19th September when prices were near 18k mark. This is for the 5th consecutive top that Nifty made we have been able to catch it precisely using Time cycle and Neo wave pattern along with simple indicators like RSI.

Infact we have also mentioned slowing momentum when prices were reversing and RSI indicator failed to show desired momentum. 

Now as prices have moved below 17160 important support is broken as per 55 Days cycle and so bigger time will remain on the sell side and top at 18091 will not be taken out until 4th November 2022. This is vital information for option traders. Similarly short term Time Cycles can be used to take swing or intraday trades accordingly.

In a nutshell, Nifty remains in sell on rise mode as long as Gap near 17350 – 17400 is protected and breach below 16970 will further accelerate the selling pressure. Volatility can be high, sharp pullbacks possible but avoid getting trapped unless 17400 breaks.

Mentorship on Trading – Learn the science of Trading Time with simple step by step approach over the period of 3 months and get exclusive access to Master of Cycles program. Time is the most essential element to Trade and very few are talking about this science. Be a part of upcoming Mentorship on Trading with live trading sessions, Handholding, Stock selection, Time tools with no prior knowledge required. Check here for more details

Thursday, September 22, 2022

Why MENTORSHIP on Timing the Market for Successful Trading?


Time is the essence in the current market scenario and this can Transform your trading journey | How to Time the markets and why it is important | Ashish Kyal, CMT Learn the science of Timing the market over more than 3 months with lifelong association, live trading sessions, Algo creation and everything focusing on Time trading, Register here OR Contact us on +919920422202
-----------------------------------------------------------------------------------
We would love to connect with you on Social Media:


----------------------------
"SEBI “Research Analyst” No: INH000001097
Write to us on : helpdesk@wavesstrategy.com 
Contact us: +91 9920422202 

Thursday, September 15, 2022

Bank Nifty - How to Identify the trade by combining Elliott wave and Price Indicator

Elliott wave helps us to navigate the trend of the market. Bank Nifty has continued to be showing a strong up move over the past few sessions. It has worked out well especially if you know how to apply Elliott wave along with technical indicators.

We published the following research on Bank Nifty before the market opens on 12th September 2022 in "The Financial Waves Short Term Update" which our subscribers receive pre-market every day.

Bank Nifty Daily Chart as on 12th September 2022 (Anticipated):

Bank Nifty Daily Chart as on 15th September 2022 (Happened):

Wave Analysis as we published on 12th September 2022:

On the daily chart, we have applied Bollinger Bands. we have shown the Bollinger Bands wherein we can see the price is tearing outside the upper Bollinger band for a couple of hours. Prices have a tendency to enter back inside the Bollinger band after a period of overextended move in a particular direction; hence buying may emerge if able to give breakouts of its upper Bollinger band again. Currently. prices are moving in form of wave g.

In short, Bank Nifty looks sideways to bullish. Use dips as a buying opportunity for a move towards 40700 as long as 40000 holds on the downside.

Happened:

After completing wave f near 32400 levels, there is clear higher high higher low structure and prices have decisively taken out the previous swing resistance in today’s session which was near 41800 levels. After a dip near 40300 levels index moved as we expected. In today’s session Bank nifty made high of 41840 levels giving more than a 3.5% move within 3 trading sessions. This early move can be easily identified using wave theory along with simple indicators.

Neo wave - Advanced Elliott wave with Hurst’s Time Cycles method and Ichimoku cloud scheduled on 17th – 18th September 2022. These methods can simply change the way you ever trade the markets. It can be done by anyone even who is a fresher as the technique is independent to other methods. Time is now to trade fearless with confidence and accuracy, Learn from Ashish Kyal, CMT, Author of International book. For more details check here

Wednesday, September 7, 2022

Nifty – Pattern Breakout Is Near, Are You Ready!

Nifty has been moving precisely the way we have been expecting as per the pattern of Elliott wave / Neo wave.

It formed a big triangle and this was predictable even before the same happened.

We have published the below chart in daily equity research report “The Financial Waves short term update”

Nifty hourly chart: shown in morning on 2nd September


Happened:


Anticipated – Following was mentioned in the morning before the markets opened in daily equity research“We can clearly see sharp decline in US DJIA where there is constant selling post the FED Hawkish stand. Nifty attempted to buck the trend but failed and only trapped both calls and put sellers on either side.

From Neo wave perspective the current leg is wave (g) which is forming triple corrective pattern. Prices are now in the 3rd correction that can be seen on the hourly chart. The overall trend looks matured but we need a clear price action confirmation which is missing so far. The last rising segment is from 17168 and so two stage confirmation will be below that level which will indicate the top is in place.

For now, short term sideways action is expect as per the path shown on the chart above in form of triangle. Move below 17470 can drift index towards 17370 levels or lower whereas move above Gann number of 17756 is required for deeper upside rally. Until then sideway action for a day or 2 from here.

In a nutshell, volatility can subside from here on and move above 17756 will be bullish whereas break below 17468 can take index lower”

Happened: Nifty moved precisely as per the path shown in the research on 2nd September before market opened and consolidated within the above range without giving a single hourly close either above 17756 or below 17468. This shows the power of pattern analysis using advanced Elliott wave – Neo wave methods.

In a nutshell, by knowing the pattern trading becomes extremely easy and one can form option strategy basis of this. Also this is not a post move analysis but it was published and documented much before the move happened. Even we were able to catch a top as per 55 days Time cycle on 17th August again this time near 18k levels when majority was super bullish on basis of Neo wave and Time cycles.

What are you waiting for to learn this science and practice it yourself? Here is an opportunity to learn about Elliott wave, Neo wave and Time cycles that can give you the edge over everyone else for trading effectively with high accuracy without worrying what the news or events going to be. This will be eye opener sessions on 17th – 18th September 2022 Saturday and Sunday with recordings of 6 hours of video given even before the session starts, post session for Q&A and much more to make you Master of Waves (MOW) by Ashish Kyal, CMT, Author, winner on CNBC TV18, CNBC Awaaz, Limited seats only, Know more here

Monday, September 5, 2022

Bank Nifty 15 Minutes Triangle Breakout + Time Cycle

 Bank Nifty is moving as per Elliott wave / Neo wave pattern and also precisely as per Time cycle even on a 15 minutes chart. Elliott wave and Time cycles are powerful forecasting techniques with a complete trading system itself.

Bank Nifty 15 minutes chart:

Elliott wave analysis

Above chart shows a standard Extracting Triangle pattern as per Neo wave. Difference between Elliott wave and Neo wave is that Neo wave has more rules for Impulse pattern and newly defined patterns like DiametricExtracting Triangle with objective ways to apply those rules. So, Neo wave is an extension of Elliott wave but with complete system to trade from Intraday, Positional to Investments.

Now in above chart, Bank Nifty formed an Extracting Triangle pattern. This is a 5 legged pattern with the downside move getting smaller that is wave (e) is smaller than wave (c) which is smaller than wave (a). On other hand, wave (d) is bigger than wave (b). We can clearly see this in above chart.

Time cycles – Bank Nifty is forming low every 89 period on a 15 minutes Time frame. A low does not necessarily mean major low but it can be minor low as well. When the wave pattern is in sync with Time cycle that is the time one can take good positional bet. There is a unique way in which Time should be looked at and its application in correct fashion is most important.

We can see in above chart that wave e completion is confirmed above 39600 and also the time has been supportive. Both combined together gave a classic indication for a positive move on Intraday basis in this index.

In a nutshell, Neo wave + Time cycles is lethal combination that a trader can use as a complete system with clear targets, stoploss and can be used as a signal.

Learn Neo wave - Advanced Elliott wave with Hurst’s Time Cycles method and Ichimoku cloud scheduled on 17th – 18th September 2022. These methods can simply change the way you ever trade the markets. It can be done by anyone even who is a fresher as the technique is independent to other methods. Time is now to trade fearless with confidence and accuracy, Learn from Ashish Kyal, CMT, Author of International book. Know more here