Tuesday, September 21, 2021

Announcement: How to Time the Stocks Using Cycles? by Ashish Kyal, CMT


Time Forecasting and Cyclical Analysis Combining Hurst’s, Gann Cycles – Master of Cycles (MOC). It is thrilling to experience to trade with time in your favor. Learn this simple tool of timing the market to the very Day, Hour and Minute. Join now Master of Cycles Program on 09th & 10th October 2021. Enroll here
We would love to connect with you on Social Media: Twitter - https://twitter.com/kyalashish/ Instagram - https://www.instagram.com/kyalashish/ Facebook - https://www.facebook.com/AKTradingGurukul Telegram - https://t.me/AKTradingGurukul LinkedIn - https://www.linkedin.com/in/ashishkyal/ ---------------------------- "SEBI “Research Analyst” No: INH000001097 Visit us : https://www.wavesstrategy.com/ Write to us on : helpdesk@wavesstrategy.com Contact us: +91 9920422202

Monday, September 20, 2021

Nifty Moon Cycle – Will It Push Prices Higher Again!

Lunar Cycles are well known for varied reasons but we are extending that study to stock market and Nifty.

It is widely known that on Pournima or Full Moon days there is natural up thrust of energy. This also results into a high tide in the ocean. Not only is that but it also impacts the human behavior in a way that amplifies the social mood.

Now what it has to do with stock market?

See the below chart of Nifty with the full moon being marked

Nifty daily chart:

Cyclical analysis: Above chart clearly showcase that almost on all the occasions post the Full moon or Pournima, Nifty has continued to move in the upward direction.

Most of the dips or consolidation also occurred during the period between the new moon and the full moon. (The empty circle above the chart is No Moon or New moon and the highlighted circle below the chart is full moon).

Also this study is working extremely well as the overall trend is on the upside or markets are driven by positive social mood and the same gets amplified post every full moon cycle.

We are not trying to do any pseudo-science but identifying the repeatable patterns that provide trader with opportunity that can be exploited to trade probability in favor. 

It will be interesting to see that with the Full moon now due and prices near the channel support if markets can start finding positive thrust over next two days and repeat the history again! Interesting, Isn’t it!

This cycle is observed by one of our participants of the Mentorship batch and it simply reflects the transformation that is instilled in Mentees to see the markets in a way not everyone might observe. Simple techniques but different perceptions can make all the difference.

Master of Cycles – Live event on 9th - 10th October 2021, it is possible to forecast Price using Time as well. Only a few big funds and HNI players use this technique of timing the market which is simple and powerful tool. This can change the way you trade and convert your loosing position into a profitable one only if you time it well. Early Bird Ends on 25th September 2021 – Know more

Be a part of upcoming Mentorship on Timing the Markets starting in November 2021 and learn the science and essence of Time. We combine the above cycle with smaller cycles to time it to the very Hour and Minute. Mentees will get access to Live Master of Cycles program on 9-10th October along with Option Trading Using Technical analysis (OTTA) and Master of Waves (MOW), Early Bird Ends soon – For more details WhatsApp on +919920422202

Stocks to Watch Today ET NOW 20th September 2021


Time Forecasting and Cyclical Analysis Combining Hurst’s, Gann Cycles – Master of Cycles (MOC). It is thrilling to experience to trade with time in your favor. Learn this simple tool of timing the market to the very Day, Hour and Minute. Join now Master of Cycles Program on 09th & 10th October 2021. know more
We would love to connect with you on Social Media: Twitter - https://twitter.com/kyalashish/ Instagram - https://www.instagram.com/kyalashish/ Facebook - https://www.facebook.com/AKTradingGurukul Telegram - https://t.me/AKTradingGurukul LinkedIn - https://www.linkedin.com/in/ashishkyal/ ---------------------------- "SEBI “Research Analyst” No: INH000001097 Visit us : https://www.wavesstrategy.com/ Write to us on : helpdesk@wavesstrategy.com Contact us: +91 9920422202

Friday, September 17, 2021

Sensex Target 61k, Predicted in 2013 - Here is the proof by Ashish Kyal


Why Nifty, Bank Nifty and ITC moving up and is there a way you can ride this trend? See in this video my targets for Sensex at 61k, ITC, Bank Nifty at 40k predicted in year 2013.

Time Forecasting and Cyclical Analysis Combining Hurst’s, Gann Cycles – Master of Cycles (MOC). It is thrilling to experience to trade with time in your favor. Learn this simple tool of timing the market to the very Day, Hour and Minute. Join now Master of Cycles Program on 09th & 10th October 2021. know more
We would love to connect with you on Social Media: Twitter - https://twitter.com/kyalashish/ Instagram - https://www.instagram.com/kyalashish/ Facebook - https://www.facebook.com/AKTradingGurukul Telegram - https://t.me/AKTradingGurukul LinkedIn - https://www.linkedin.com/in/ashishkyal/ ---------------------------- "SEBI “Research Analyst” No: INH000001097 Visit us : https://www.wavesstrategy.com/ Write to us on : helpdesk@wavesstrategy.com Contact us: +91 9920422202

Monday, September 13, 2021

3 Powerful Indicators on Nifty (That Actually Work)

By combining Ichimoku Cloud, Elliott Wave and Open Interest analysis it is possible to form a powerful trade setup.

Diametric pattern is defined as per Neo wave and it consists of 7 legs. A peculiar behaviour of this pattern is that wave g tend towards equality with wave a, wave f tend towards equality with wave b and wave e tend towards equality with wave c.

Now look at the below chart for further understanding

Nifty 30 minutes chart:

Elliott wave analysis

Nifty on a 30 minutes time frame shows Diametric pattern with prices currently moving in the form of wave f. We can clearly see that wave b came near the cloud support before the wave c started and similar behaviour is observed even now when wave f is near the support of the cloud and looks similar to that of wave b. A break above 17400 will further confirm that wave f is over and we will have wave g starting upwards.

As per Fibonacci equality target of wave g to that of wave a we will get targets near 17500 for the current ongoing up move and one can accordingly take trading positions.

Open Interest analysis: 
OI profile chart shown along with prices gives further conviction for identifying key reversal areas. We can see that 17300 is near term support as there is high build up in OI for Put options of 17300 strike price and 17500 is highest OI for call OI. So break above 17400 can provide a good opportunity for a move atleast towards 17500 levels.

The above research clearly showcase how Ichimoku Cloud, Neo wave and OI profile can help in taking a clear trade setup for Option traders and form the strategy accordingly. These are simple yet powerful methods of forecasting and trading the markets.

Subscribe to the Multibagger, Momentum, Nifty / Bank Nifty calls that are derived on basis of these methods directly on whatsapp / sms and also get research report along with it free to enhance your learnings.

Create your portfolio of outperforming Multibagger stocks in this ongoing strong trend for the coming year – know more here

Want to ride the momentum for 8% to 10% target with prudent risk reward and clearly defined stoploss – Get access to Momentum calls more here

Nifty / Bank Nifty calls – Want to trade only index on intraday or positional basis – check here

Mentorship on Timing the Markets: Mentorship starts in November that will ensure you become an Expert Trader with clear defined strategy, disciplined approach and science to forecast the markets. Time is the most essential element and we will provide over the period of 3 months all necessary tools required for one to become a profitable trader using Options. Simply fill the below form here more details.

Thursday, September 9, 2021

Option Trading using volume Profile and OI Profile by Ashish Kyal, CMT


Upcoming Event - 3 Months of Mentorship On Timing the Market for the FIRST TIME EVER Trade-in Real-Time With Discipline and Confidence using Time Cycles. A scientific Approach to Successful Trading. Know more: https://www.wavesstrategy.com/mentorship/

-------------

We would love to connect with you on Social Media: Twitter - https://twitter.com/kyalashish/ Instagram - https://www.instagram.com/kyalashish/ Facebook - https://www.facebook.com/AKTradingGurukul Telegram - https://t.me/AKTradingGurukul LinkedIn - https://www.linkedin.com/in/ashishkyal/ ---------------------------- "SEBI “Research Analyst” No: INH000001097 Visit us : https://www.wavesstrategy.com/ Write to us on : helpdesk@wavesstrategy.com Contact us: +91 9920422202

Tuesday, September 7, 2021

Nifty Fibo Diametric Pattern on Hourly and 15 Minutes with Ichimoku

Nifty Elliott Wave – Neo wave pattern has continued to show amazing outcome with prices moving in tandem with the wave patterns. Many are seeing this movement on basis of news but the wave structure is helping us forecast each and every move and below charts clearly shows that.

Nifty Diametric pattern is very clear on the charts and with the help of Ichimoku Cloud this can be identified easily.

Nifty 60 minutes chart:

Nifty 15 minutes chart:

Elliott Wave analysis:

Nifty 60 minutes chart shows that the entire rise from the lows of 14500 has been in the form of (a)-(b)-(c) pattern with wave (c) currently ongoing. The internal structure of wave this (c) is also corrective Diametric pattern. This suggests that the entire move from 14500 can develop itself as a Diametric or a Neutral Triangle and prices are currently in wave (c).

Fibonacci projection: Wave (c) projection to that with wave (a) comes near 17500 where wave (c) = 138.2% of wave (a). This gives us tentative level to watch on upside and we will come out with further upside targes only ince 17500 is taken out.

In order to take exact entry and trade it at times important to see even the 15 minutes chart along with Ichimoku Cloud.

Nifty 15 minutes chart: Nifty showing a clear double corrective rise within wave (c). The internal structure of this wave (c) is shown and prices are currently in wave f of minor degree. Everytime prices move towards the Ichimoku cloud and away from the cloud there is change in the wave count and it is simply amazing to see how prices have behaved so far.

In a nutshell, we can expect one more push higher in form of wave (g) and post that it will be important to see prices manages to find resistance near 17500 where the equality target is mentioned. Break below the cloud will confirm that the entire wave (c) is getting over and wave (d) lower is probably starting.

A clear trade strategy can be formed by combining these simple methods of Neo wave theory along with Ichimoku cloud.

Subscribe to “The Financial Waves Short Term Update” equity research which covers Nifty, Bank Nifty, Stocks detailed Elliott wave outlook. Get access here

Mentorship on Timing the Markets for the FIRST TIME EVER starts November 2021 – In this Mentorship program, all the necessary tools are given right from stock selection methods, strategy, follow-up action to derive a complete trade setup in step by step fashion. To know more check here

Thursday, September 2, 2021

Titan – Elliott wave Momentum Call Strategy

Titan has shown a sharp rise and exhibited classic Impulse rise as per Elliott Wave.

We gave Titan call to our Momentum calls and research subscribers on 13th August and the stock is up by 8% since then! checkout how we identified this winner.

TITAN 1-hour Chart: (as of 13th August 2021)
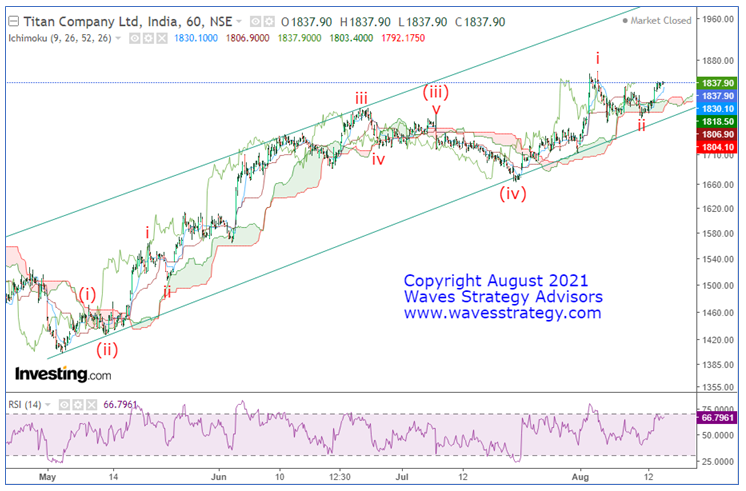
Momentum stock recommendationTITAN

Buy Price – Buy above 1835

Time Horizon –Not Applicable

Investment – 5% of capital

Target price – 1980

Partial Profit: 1908

Stop loss– 1760

*Trail stop to cost after booking partial profits to ensure capital protection*

Refer detailed research below

TITAN 1-hour Chart: (as of 02nd September 2021)
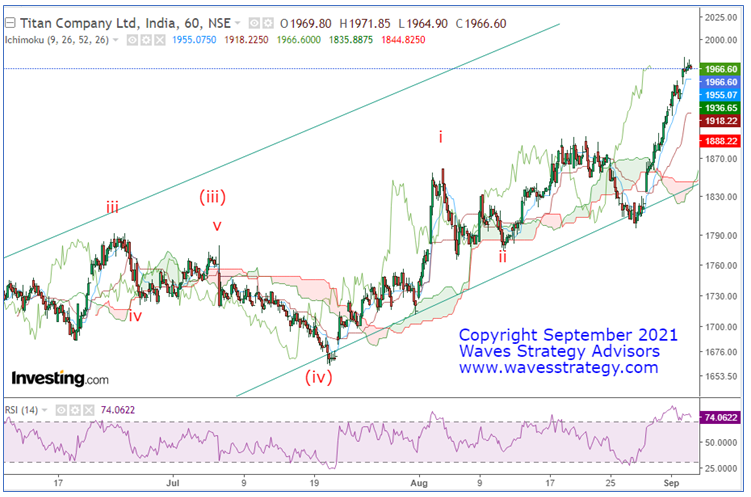
Wave analysis:

TITAN is showing strong impulsive rise. On the 1-hour chart of the stock we can see that wave(v) has started unfolding on the upside and the internal counts of this wave are corrective in nature. As shown on the chart, we can see that price is moving along the rising channel and after the completion of minor wave ii of wave (v) price has decisively moved above the ichimoku cloud.

This confirms that wave iii has started on the upside. The third wave in a motive wave can

never be the smallest hence we expect price to move at least in equality with the first wave.

TITAN can be bought above 1835 levels and we expect it to move towards 106 levels. A

stoploss must be placed below 1760 levels while It’s best to book partial profit near 1908 levels and trail stoploss to cost to ensure capital protection.

Happened: The call initiated on 13th August and as of today the stock has almost hit our target of 8% near 1980 levels.

Simply imagine one can trade only on the basis of 1 indicator which is Elliott Wave without combining it with any other tools. That is the power of Elliott wave method if one knows the correct application of the same.

Last 2 days left...Are you with me for Master of Waves S2.2, Want to get thrilled by forecasting markets right from the next few minutes to few days, find option expiry levels and much more? Training on Advanced Elliott Wave – Neo Wave and Hurst’s Time Cycles, Get onboard now for 4 - 5th September 2021.  know more