Thursday, December 22, 2022

What is difference between Elliott wave and Neo wave? Application on Nifty charts.

Neo wave is an Advanced Elliott wave method with a greater number of rules and newer patterns to increase the overall objectivity. Whereas Elliott wave which was originally discovered by R. N. Elliott in 1930s. His original work mentioned that stock market does not move randomly but in systematic fashion. This systematic movement in prices are in form of waves. Normally there are 5 steps forward and 3 steps backward resulting into a net progression which is valid for stock market as well.

Any price movement as per basic Elliott wave is classified into Impulsive and Corrective. There are various patterns within these broader heads. Impulsive waves need to follow three basic rules:

1: Wave 2 cannot retrace complete of wave 1

2: Wave 3 cannot be the shortest of the directional waves 1, 3 and 5

3: Wave 4 cannot enter into territory of wave 1

The above 3 basic rules if followed then the price movement under consideration can be classified as a normal Impulse wave. However, when the market structure is complex there is possibility that the movement can be counted in many different ways. This can result into subjectivity and the entire purpose of wave theory can be lost. To overcome this limitation Neo wave was developed that has more than 15 different rules to define a simple impulse pattern. Following are a few of them:

1: Wave 2 cannot retrace more than 61.8% of wave 1

2: Wave 3 cannot be the shortest of the directional waves 1,3 and 5

3: Wave 4 cannot enter into territory of wave 2

4. Wave 2 should take more time than wave 1

5. Wave 4 should take more time than wave 3

6.  2 stage faster confirmation virtually guarantees that trend is over and bigger trend has started in opposite direction

The above shows only a few sets of rules for an impulse pattern as defined by Neo wave. I will be discussing all the rules more in detail in Masters of Waves Online training happening on 7th-8th January 2022.

We take a step ahead and combine this complex study of Neo wave to that of Time cycles. It is not always that both the studies will be in sync but when they are then if we combine it with time then the trade set up is of high accuracy which have the potential to give the best of the returns in shortest amount of time.

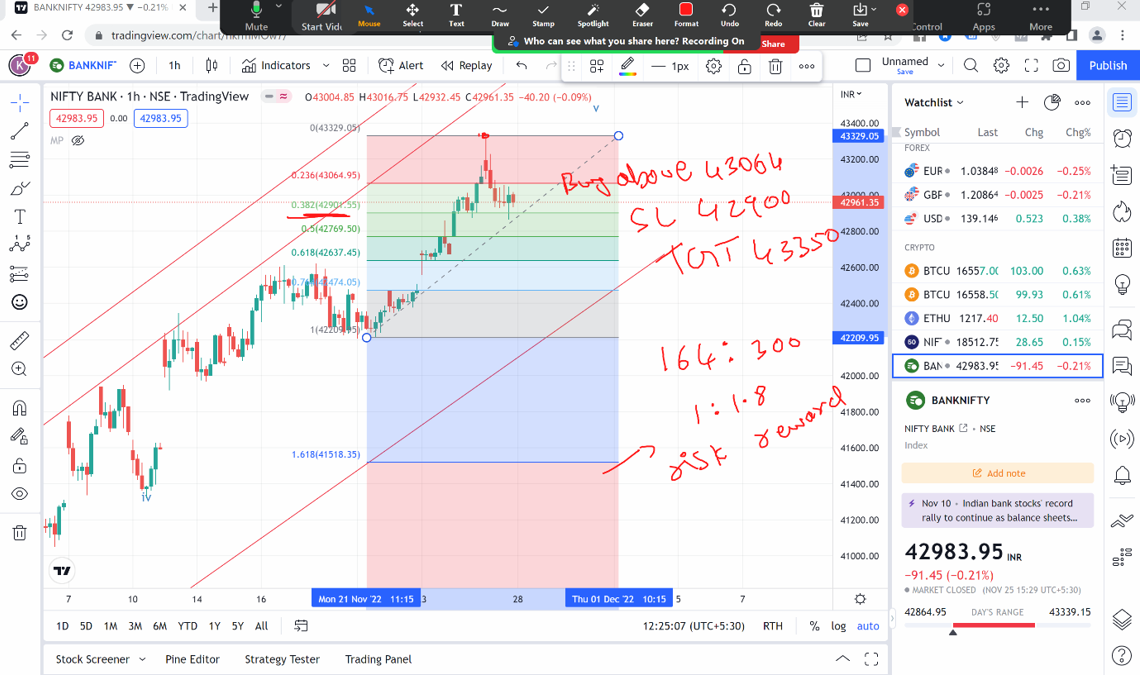
Below part of research was shown on 22/12/2022

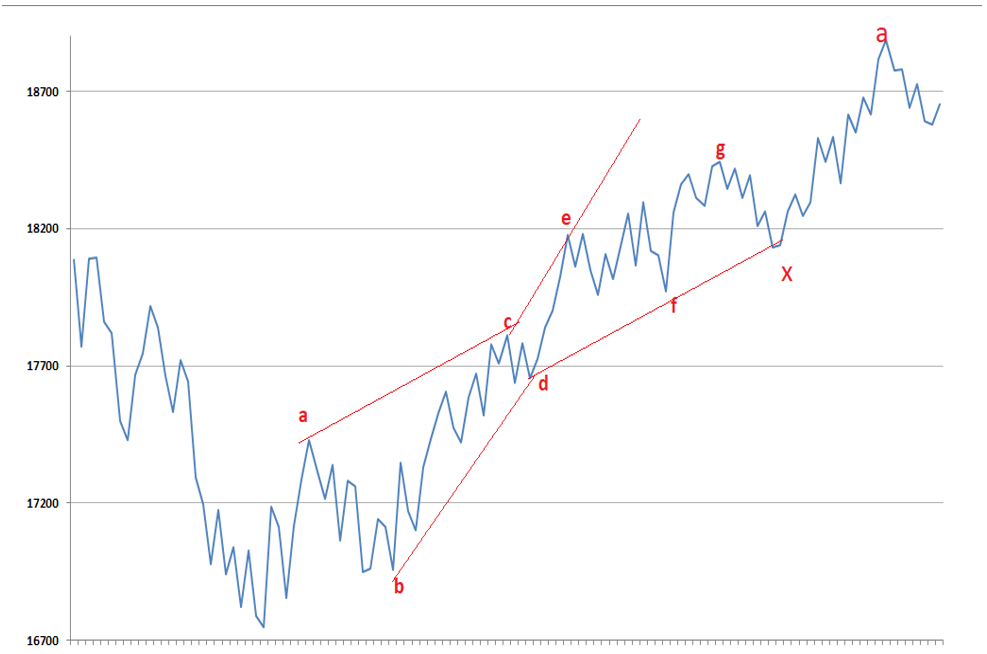
 Nifty 60 mins chart (anticipated)

Neo wave analysis

Nifty had a gap up opening in the previous session prices could not sustain higher and sharp selling was witnessed. Nifty at the end of the day formed a long bearish candle which suggest weakness in the indices. Shortly, prices are expected to move towards 18050-18100 levels. Whereas on the up side 18480 is nearest hurdle on the upside. Fresh buying can be seen above breach of the same.

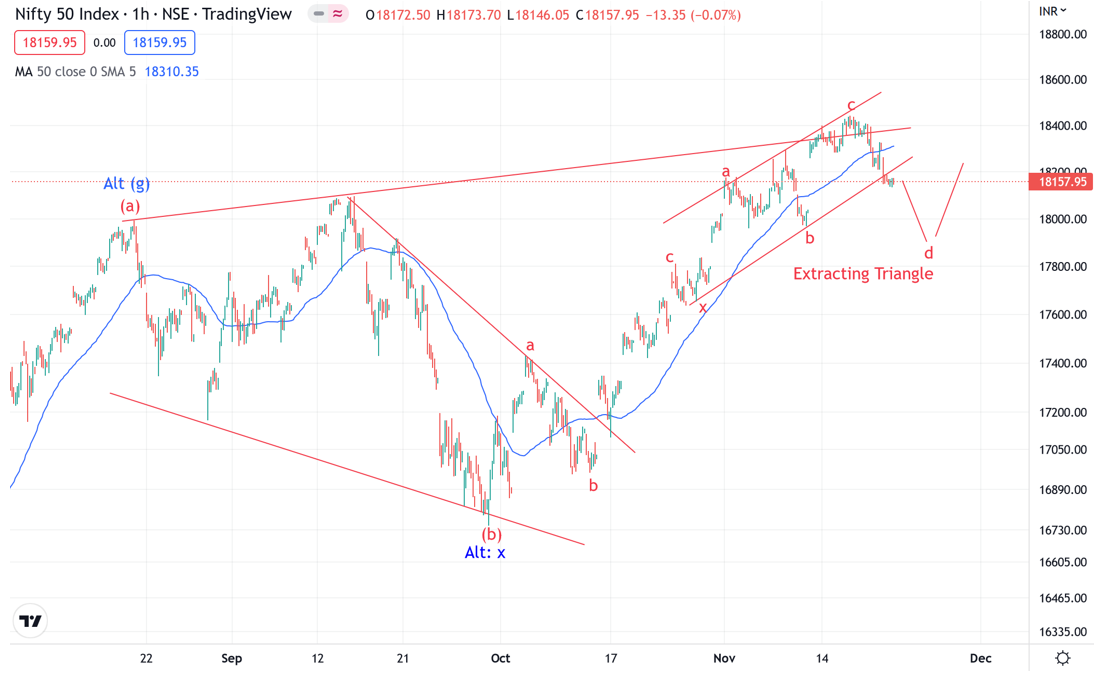
On the hourly chart, prices seem to have followed lower high lower low formation. This suggest that short term bias can continue to remain negative as long as we do not see a close above previous candle’s high. On the other hand, prices have moved down by taking resistance of the cloud which suggest that any pullback towards it can be used as a shorting opportunity, valid as long as 18480 holds on the upside.  As per wave perspective, prices have completed wave c on the upside which opens possibility of a C failure flat pattern.

In a nutshell, Nifty had a volatile day and formed a big red candle end of the day. For now, use pullbacks as a shorting opportunity for a move towards 18050-18100. Whereas any break above 18480 is needed for fresh buying to emerge.

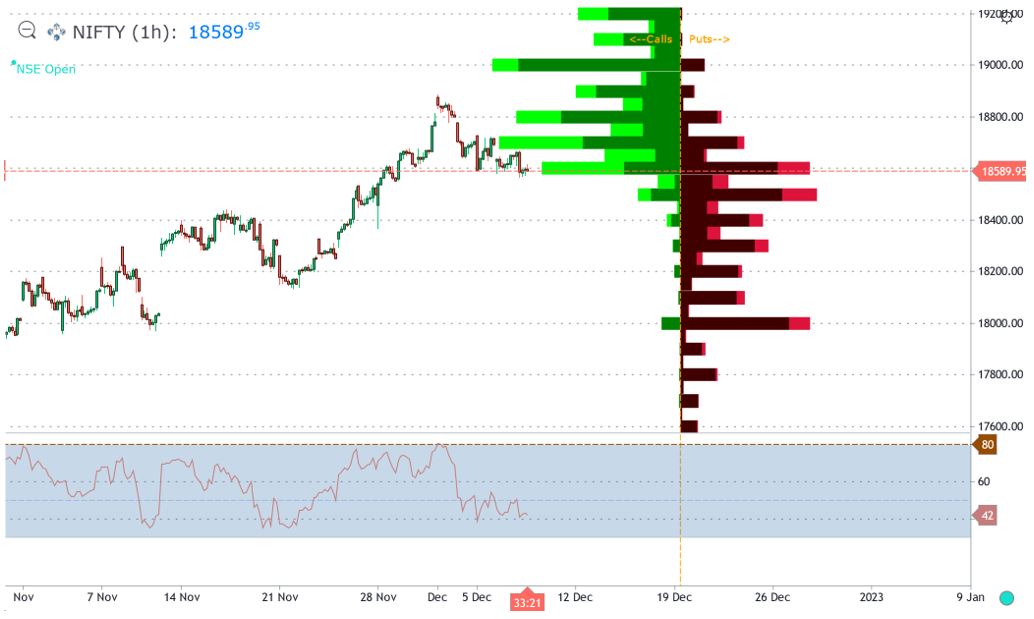
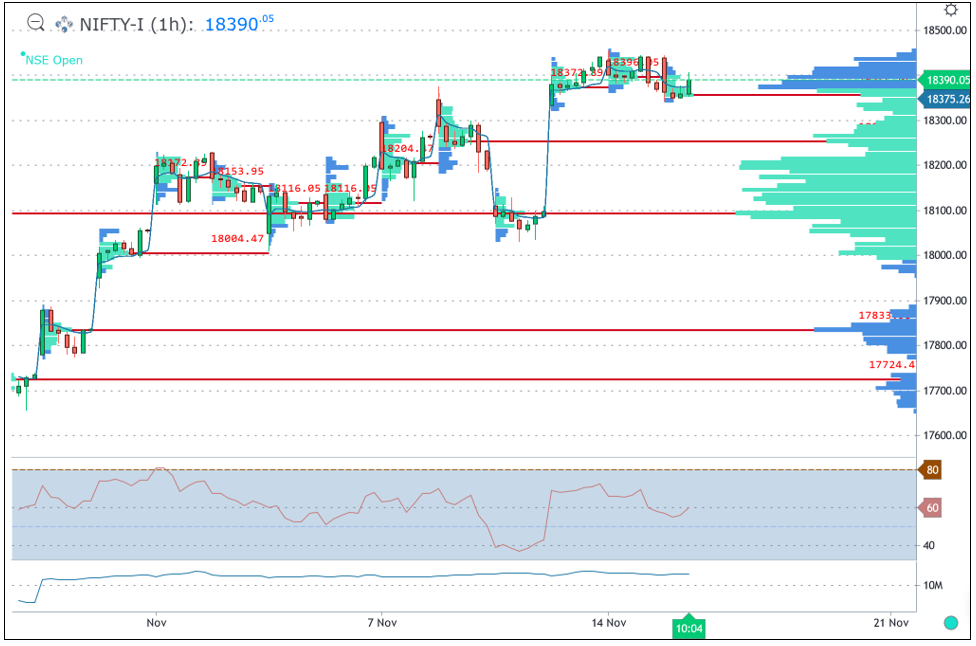
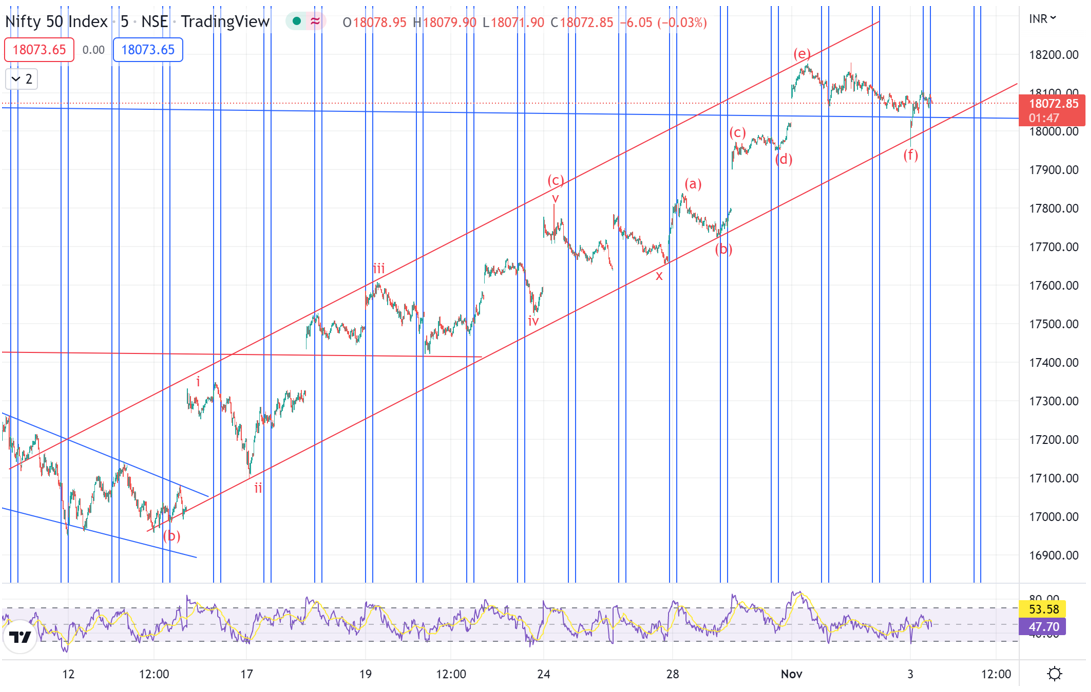
Happened as on 22nd December, 2022

HappenedNifty after a pullback made low near 18080 which almost near our second target of 18050.

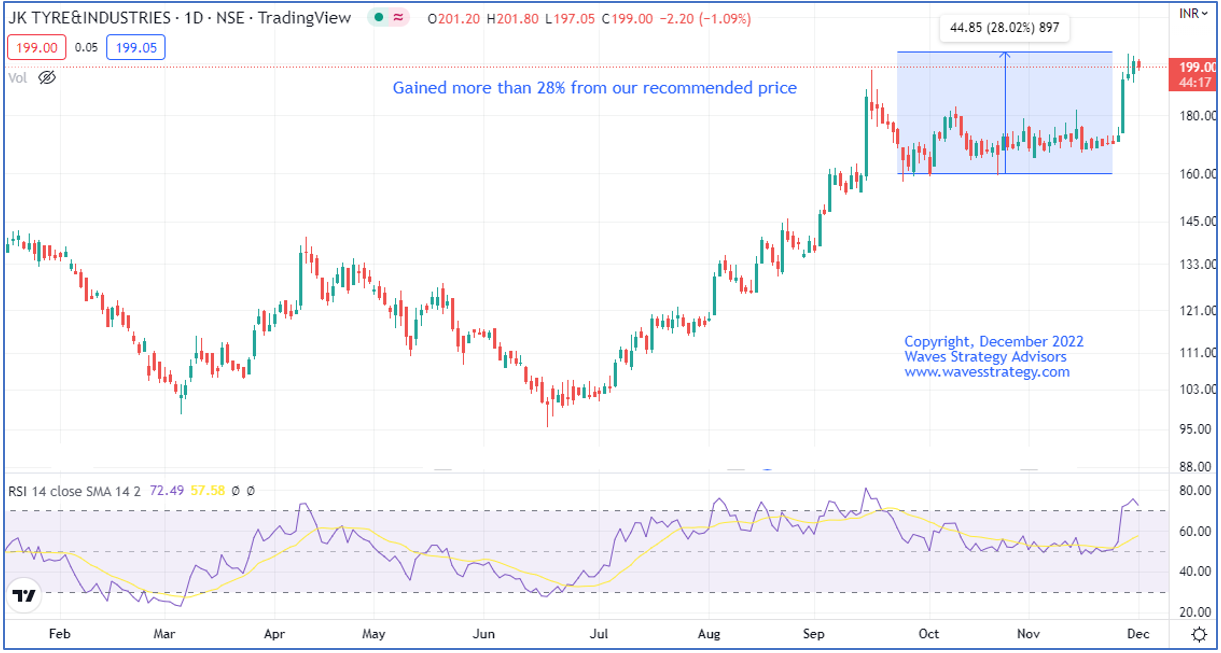
The above chart clearly shows how understanding Neo wave pattern helped us to catch a total move of more than 400 points which we have been mentioning in our research report since past 2 days.

Subscribe to “The Financial Waves short term update” daily equity research report that covers Nifty, Bank Nifty, stocks providing good trade setups on daily basis. Subscribe here

Master of Waves (MOW) Learn the science of Trading using Elliott wave, Neo wave and Time cycles for short term to long term forecasts in Master of Waves (MOW) – Most advanced Training on Technical analysis that will give the necessary edge to traders both for Intraday to Positional trading on 7th and 8th January 2023. Early Bird Ends on 25th December 2022. Know here 

Friday, December 16, 2022

Nifty - Will it Crash Again or Opportunity to Buy! | Ashish Kyal


Do check out Options Trading course along with Elliott wave, Neo wave and Hurst's Time cycles over here - https://www.wavesstrategy.com/bmw/
________________________________________________


Download "My Institute" App and enter org code: esiad
-----------------------------------------------------------------------------

Sebi registered Research Analyst Waves Strategy Advisors, For daily advisory services and research reports visit the website 


Disclaimer: All the videos made on this channel are for educational purposes. 


Wednesday, December 14, 2022

Inflation a Lagging Indicator – Useless to See Inflation and Trade the Markets

 Inflation looks to be the logical reason why markets are moving up or down to majority of traders.

However, historical data suggests that inflation is lagging whereas stock market is leading.

Below research is picked up from monthly research report published on 14th November 2022 – The Financial Waves Monthly update

Inflation and Markets - Above chart shows overlap of Sensex chart along with inflation data. We can clearly see from above that Sensex has continued to rise despite of rising inflation which has no strong correlation with prices. The reason being inflation is economic data that is lagging indicator. The data that we see now is for past months or quarter. Whereas, stock market is forward looking and discounting the future. So, Sensex is leading whereas Inflation is lagging.

Above chart highlights this lead lag behavior clearly. We can see that the major bottoms made in Sensex much earlier than the inflation started picking up. Classic example can be the top made in February 2020 when Sensex crashed sharply. Inflation was still running higher near 7% at that point of time which shows sharp decline only later in September 2020. Similarly, Sensex bottomed out in last week of March 2020 but Inflation bottomed out in November 2020 before slowly starting to inch higher. Sensex topping near 61000 in October 2021 is also followed by Inflation topping out in April 2022.

With equity markets again starting to inch higher there is high likelihood that we will start seeing inflation picking up again in lagging fashion. So many, who might be thinking inflation and interest rates have peaked out are here for a surprise and both the inflationary cycle and interest rate cycle is still in upward trajectory. It is only once we see fall in Nifty or Sensex we can have comfort of easing inflation in near future.

In a nutshell, many are tracking inflation to forecast the markets whereas it has to be exactly the opposite way of tracking markets to see if inflation is going to increase or not and in turn the interest rates! Simple way of looking at things that can change the very perspective by plotting out in form of charts.

Subscribe to Monthly research report and see medium to long term forecast on Nifty, Sensex, Bank Nifty, USDINR, DJIA, Gold, Global markets all in one report. Get access here

Learn the science of Trading using Elliott wave, Neo wave and Time cycles for short term to long term forecasts in Master of Waves (MOW) – Most advanced Training on Technical analysis that will give the necessary edge to traders both for Intraday to Positional trading on 7th and 8th January 2023. Know more here

Friday, December 9, 2022

Nifty Trading using Ichimoku Cloud and OI Profile | Ashish Kyal


Ichimoku Cloud helps to understand the overall maturity of trend. This clubbed with Open Interest chart provides vital information for Option Traders. Is it Time to Buy or Sell? Trade setup for coming week by stock market expert Ashish Kyal, CMT, Author

Do check out Options Trading course along with Elliott wave, Neo wave and Hurst's Time cycles over here - https://www.wavesstrategy.com/bmw/
________________________________________________


Download "My Institute" App and enter org code: esiad
-----------------------------------------------------------------------------

Sebi registered Research Analyst Waves Strategy Advisors, For daily advisory services and research reports visit the website 


Disclaimer: All the videos made on this channel are for educational purposes. 

Wednesday, December 7, 2022

Nifty Trading Using Neo wave with Open Interest profile

 Neo wave is advanced Elliott wave method that helps to understand the overall maturity of trend. This along with Open Interest chart provides vital information for Option Traders.

Post RBI policy announcement prices showed decline on downside but is still stuck in a range.

Neo wave plot is different than that of Candlesticks. Over here we can see the internal structure of wave patterns extremely clearly.

Nifty Neo wave plot daily chart

Nifty Neo wave plot 60 minutes chart


Nifty Open Interest profile

Nifty daily chart clearly shows the up move to be in form of 7 legged Diametric pattern. Earlier we were expecting it to be a Flat followed by x and then a Diametric but given the latest data this count looks best fit.

Prices post completing wave x, moved up in form of wave a and now wave b is going on. The internal structure of wave a is all corrective and so we might be either in a Triangle or Diametric pattern again. Current ongoing wave if closes below 18570 – 18560 then prices can head towards 61.8% to 76.4% retracement giving the target as 18420 levels. Failure to do that can continue the sideways action with hurdle near 18730 on upside.

Post completion of wave b, we can expect wave c to start higher again in direction of the medium term trend which is up as of now.

Open Interest analysis -  Nifty 3rd chart shows sharp rise in 18600 Calls and Puts OI. It shows tug of war between Bulls and Bears for now and Option traders are creating short straddle positions expecting market to be trading in a range. Move below 18560 will result into short covering by put sellers are 18600 thereby putting pressure. On upside 18700 has major hurdle as per OI data.

In a nutshell, Neo wave and Open interest can be classic combination to trade effectively to predict the market direction and once two stage confirmation (Neo wave technique) is obtained one can get very high conviction Option buying opportunity.

Learn to Trade Options with KST and Elliott wave – 3 Days to go for Options Trading Using Technical Analysis (OTTA) scheduled on 10th and 11th December 2022, 5 Trade Setups for Option buying and selling along with Ichimoku Cloud, KST indicator, Volume and Open Interest profile, Option chain analysis, Payoff charts with Indicators like Bollinger Bands. Be a part of this Elite Traders community. For more information check here

Monday, December 5, 2022

Nifty Options Trading Using Volume profile – Big Player Activity!

Nifty Volume profile is classic way to see where the positions are built up by big players. To trade successfully one needs to trade in direction of the bigger positions.

Below is hourly chart of Nifty 18500 call option month end expiry that shows volume activity.

Nifty 18500 Call Options 60 minutes chart

Volume Point of Control – As we can see in above options chart Volume point of Control is near 350 where major positions are build. Prices came near to this POC after breaking out on upside. This type of pullbacks are opportunity for Options Trader to re-enter into the Call Options of 18500 strike price as this level will be defended.

Price action is also important around this area. Any close above the prior candle high is also confirmation from the area of significance i.e. the big players are active to defend their positions.

In a nutshell, one can create good risk reward positions as long as 18500 call options are not trading below 300 levels which will indicate dumping of this strike options.

This is simple but powerful way of Trading using simple Volume profile applied directly on the charts.

Options Trading Using Technical Analysis (OTTA) – Learn to Trade Stocks and Options using above method of Volume profile, Open interest analysis, Pay off charts and much more in upcoming Options Trading program scheduled on 10th – 11th December 2022. Also learn to apply KST Time Indicator for the very first time on Options and Trade successfully. Limited seats only, Fill the below form for more details - https://www.wavesstrategy.com/bmwoffer

Friday, December 2, 2022

Nifty Trading using Gann + OI + Volume profile | Ashish Kyal


Trade F&O using Candlesticks, Elliott wave & Time cycle on 03rd December 2022, Saturday from 11am to 1pm. Register here

Learn to Trade Options using Technical Analysis (OTTA) using Volume profile, Open interest profile, Option Strategies, Payoff chart, and much more scheduled on 10th – 11th December 2022. Early Bird Ends on 30th November. Know more here

We would love to connect with you on Social Media:


----------------------------
"SEBI “Research Analyst” No: INH000001097
Write to us on : helpdesk@wavesstrategy.com 
Contact us: +91 9920422202 

Thursday, December 1, 2022

JKTYRE - Investment stock selection using Elliott wave

We published about JKTYRE in September 2022 and predicted a possibility of Multibagger returns in the coming 2-3 years. This stock has managed to hold its gain and gave almost 28% returns in 2 months of time and made a lifetime high near 204.

Below is the chart which shows a detailed analysis of JKTYRE which helped to predict this target levels using Channels and Elliott Wave technique and Time cycle. We recommended this stock when it was trading near the 175 levels and was successfully able to catch the up move.

JKTYRE Weekly chart: (Anticipated as on 23rd September 2022)

JKTYRE Weekly chart: (Anticipated as on 27TH September 2021)

Multibagger stock recommendation: JK Tyre & Industries

Buy Price – Buy at CMP 175 and more on dips towards 155

Time Horizon –2 to 3 years

Investment – 5% of capital

Target price –??

Stop loss -??

Refer to the detailed research below.

Anticipated as on 23rd September 2022– Elliott Wave Theory

We are showing the weekly chart of the stock. Prices are moving in the form of Terminal impulse since the lows of 2009 so legs will be corrective. After completing wave (2) near the lows of 32 we are now in the strongest wave [3] this is the best leg to be a part of because it can fetch maximum gains in minimum time. The prices are also respecting the Ichimoku cloud and moving higher. Stock is moving precisely within upward slopping red channel and has taken support on a lower trendline in past sessions indicating its acting as support. As long as this support trendline remains protected on downside bias remains positive.

Happened as on 1st December 2022: The stock is moving exactly as we expected. Currently, JK TYRE is trading near 199 levels. It made a new lifetime high near 204 levels on 29th November 2022. The up move has been strong and we expect prices to achieve its target of .... levels in coming months. The stock is giving a return of 28% on average return in 2 months of span.

Join Premium Telegram Community for Multibagger stocks - 12 to 15 stocks in a year - Join here

Learn to Trade Options using Technical Analysis (OTTA) using Volume profile, Open interest profile, Option Strategies, Payoff chart, and much more scheduled on 10th – 11th December 2022. Early Bird Ends on 30th November. Know more here

Tuesday, November 29, 2022

Reliance Trading Using Volume Profile – Is it BIG Trend start?

Volume profile is different than normal Volumes that majority is tracking. Volume profile showcase behind the scenes big players activity and at which price point positions are created.

Below is the chart of Reliance Industries which we discussed during the Exclusive webinar on 27th November 2022.

Reliance hourly chart – Anticipated on 27th November 2022

Reliance hourly chart - Happened

As seen in 1st chart, Reliance Industries approached the red line which is Volume point of Control (VPOC) that showed major accumulation took place near the zone of 2600 levels. As soon as this major Price action area was crossed there was sharp jump on upside and the stock rallied by nearly 4% in single day which is rare.

There are different shapes to Volume profile as well and for trader it is important to keep a track of a few concepts from this technical analysis study.

In a nutshell, Reliance Industries now have major support near 2600 and as long as this level is intact any dip can be used as buying opportunity. Simple price action using Volume profile can be a great indicator for Option Traders.

Learn to Trade Options using Technical Analysis (OTTA) using Volume profile, Open interest profile, Option Strategies, Payoff chart and much more scheduled on 10th – 11th December 2022. Early Bird Ends on 30th November. Know more here

Monday, November 28, 2022

Bank Nifty Elliott Wave & Fibonacci - GPS Path Ahead

Elliott wave is GPS of market along with Fibonacci helps to understand Targets, Stoploss and maturity of trend.

Below chart of Bank Nifty was discussed during the Exclusive live webinar on 27th November 2022 with 1000s of participants where we derived possible path for this index.

Bank Nifty hourly chart (anticipated on 27th November)

Bank Nifty Trade basis of Fibonacci

Bank Nifty in today’s session is already breaking above the resistance of 43064 levels, Nifty touched lifetime high levels. The overall undertone is positive as long as we do not see close below the previous day’s low.

Post completing wave v on upside we can expect retracement of the up move. However, that has to be driven by two stage confirmation as per Neo wave – Advanced Elliott wave technique.

By combining simple price action along with Fibonacci and Elliott wave one can derive complete trade setup for Nifty, Bank Nifty and stocks.

In a nutshell, Bank Nifty trend looks positive as long as 42900 remains intact on downside for upside targets of 43350. It is important to understand this is game of probability and one should always trade when the probabilities are favourable.

Most advanced Training on Technical Analysis - Learn the science of Trading Options using Volume profile, Open Interest profile along with Elliott wave and Neo wave in upcoming Become Market Wizard (BMW) program which is comprised of two courses Options Trading using Technical Analysis (OTTA) on 10th – 11th December 2022 and Master of Waves on 7th – 8th January 2023. To know more fill below form - https://www.wavesstrategy.com/bmw/

Tuesday, November 22, 2022

Nifty Trading Using Pring KST Buy Sell Signal

KST Indicator (Know Sure Thing) developed by Martin Pring is a powerful Time indicator.

KST indicator takes summation of multiple Rate of Change (ROC) together and smoothens it using an average. The signal line which is again an average of KST is plotted to get Buy and Sell signals.

Nifty Daily chart with Pring KST

Above Nifty daily chart shows important tops have been accompanied by turn in KST indicator. Do note that KST (green) moving below the signal (red) line does not always lead to lower prices. We can see that happening during the rise of October 2021 where KST was falling below the signal line but prices showed sharp move on upside.

Price Action with KST – It is therefore important to combine price action along with any indicator. KST is a Time indicator which is very smooth as against ROC applied directly. It does indicate that trend can possibly reverse and it is time to be alert. We can see that all the tops of Nifty over past year has been accompanied by the KST crossing below the signal line and so one can then devise a strategy to short the market on pullbacks unless KST moves back above the signal line. Shorter time frames can be combined along with daily for timing the entries.

In a nutshell, Nifty daily KST is still in buy mode whereas hourly and smaller time frames entered sell. So, during such scenario Options selling can work better. When daily KST moves below signal line followed by 0 line there can be a great opportunity to keep using smaller time frames for sell signals to trade the major trend.

Premium Trading Strategy – Get the complete trade plan looking at KST along with Price action and Bollinger Bands in just 2990 /- course over here

Become Market Wizard – Learn the science of Trading Options using Volume profile, big players activity, Open interest profile, Ichimoku Cloud and much more in Options Trading using Technical analysis (OTTA) combined with Master of Waves (MOW) – Elliott wave, Neo wave with Hurst’s Time Cycles. Both these courses together form BMW  - know more here

Monday, November 21, 2022

Nifty Neo Wave Pattern – Is the Top in place?

 Elliott wave or Neo wave act as GPS of the market. It is advanced Technical analysis study that can help traders understand if the trend is matured and about to reverse to catch important tops or lows.

We are showing hourly chart of Nifty that gives the possible path from here on.

Nifty 60 minutes chart:

Elliott wave analysis – As shown in above chart we can clearly make out that prices are moving in the form of corrective pattern and currently is in wave c. The entire structure looks expanding and we can see it failing to sustain above the upper trendline.

From Neo wave perspective, the internal structure of wave (c) seems to be double corrective. Post wave x the ongoing pattern is Extracting Triangle and currently wave d looks to be in progress. Ideally this wave d should break below the low of wave b near 17990 levels and then one pullback on upside is possible.

However, do note this is only an assumption as the pattern can also turn out to be a Diametric on upside. So one should know when to change the stand from bearish to bullish. On upside 18340 is now major hurdle which is also the Gap area. Move above this level will indicate wave d is over and ongoing pattern will then turn out to be Diametric with more bullish possibility. This will remain alternate scenario.

Thus by understanding the ongoing pattern it is possible to trade with probability in favour and one can derive prudent stoploss for positions. Neo wave is amazing tool for forecasting future and one can trade Options or Stocks extremely well once this technique is understood.

In a nutshell, Nifty short term view is bearish and there is possibility that we might start moving lower towards 17840 – 17800 levels. This is valid as long as 18340 remains intact on upside.

Subscribe to Equity research “The Financial Waves short term update” and see yourself application of these methods with Nifty, Bank Nifty, Stocks that are providing good opportunity. Subscribe here and receive research directly on Telegram

Subscribe to Premium Telegram group for Stock Futures calls over here 

Become Market Wizard (BMW) – Learn to trade Options along with simple technical concepts and combine that with Elliott – Neo wave analysis, BMW is comprised of Options Trading Using Technical Analysis (OTTA) and Master of Waves (MOW). Know more here

Tuesday, November 15, 2022

Nifty Intraday Trading Using Volume Profile

 Volume profile highlights accumulation or distribution area by big players. It is the zone where major activity has taken place during the day or week.

By understanding volume activity one can know crucial support during the day.

Nifty hourly chart – Volume profile with VWAP

Above chart shows volume activity during the day along with cumulative volume profile across multiple time frame.

We can see that major volumes have taken place near 18375 (fut) levels which is the highest volume profile area on 15th November and also on 13th November 2022.

Cumulative volume profile shows Point of Control – are of highest volume near 18090 (fut) levels. So, big players have created their positional trades near this level.

VWAP – Volume weighted average price reflects the average where the volume has happened during the day. Prices usually find support near the VWAP and Volume POC.

These are pure insights into big player’s activity and where they are creating the positions.

In a nutshell, by looking at this simple volume technique we can make out that support as per volume profile is near 18375 (fut) followed by 18250 which is also middle of the Gap area. So market will remain buy on dips as long as 18090 is intact where big players entered the market.

Learn the science of Trading in Mentorship – Trading is a science of probability. Such simple ways of looking at the markets can enhance your trading skills along with Options breakout strategy. Be a part of elite trader’s community we call as #TimeTraders. Fill the form here for more details

Thursday, November 10, 2022

Algo Trading क्या होता है ? | Ashish Kyal | Time Trading Strategy


Algo trading or Algorithm trading is the process by which computers are programmed to carry out trades based on predefined instructions called Algorithms. So, if you’re an active trader, we recommend that you use one of the above Algo trading strategies to enter and exit stocks with accuracy and efficiency. This will maximize the return on your capital. 

Learn the science of Timing the market over more than 3 months with lifelong association, live trading sessions, Algo creation and everything focusing on Time trading, Register here - https://www.wavesstrategy.com/mentorship OR Contact us on +919920422202 

We would love to connect with you on Social Media:


----------------------------
"SEBI “Research Analyst” No: INH000001097
Write to us on : helpdesk@wavesstrategy.com 
Contact us: +91 9920422202 


Thursday, November 3, 2022

Nifty 5 Minutes Trading – 3 Powerful Techniques for Intraday!

3 Powerful Indicators that one must be aware of while Trading Intraday.

We use Neo wave along with Time Cycles and Channels to understand the maturity of trend, reversal signs and catch powerful explosive moves just before it starts.

Below is Nifty 5 Minutes chart showing these techniques all combined together.

These are simple yet powerful way to trade.

Nifty 5 Minutes chart:

Neo wave analysis – Above chart of Nifty shows clearly the internal Elliott wave pattern forming. We can see that prices completed wave (c) in form of 5 waves up and post that there was an x wave formation. After that the entire rise seems to be forming a classical Diametric pattern which is labeled as a-b-c-d-e-f-g and prices are currently in wave (g) which means matured stage of up move. Low made near 17960 on Gap down is now the crucial support as break below it will also breach the channel that has been protected in this entire rise and will also confirm wave (g) up is over.

Two stage confirmation is powerful technique again in Neo wave and it virtually guarantees when the trend is over with high risk reward trade setups.

Time Cycles – This is next powerful indicator that we use to understand enter the trend when the time is right. For Option traders if timing goes wrong making money is near to impossible. 5 minutes Time cycle period of 64 is working just amazing. Look at the start of most of the up waves precisely from this cycle low.

Channels – Next powerful technical analysis method but ignored by majority of traders.

In a nutshell, Nifty is in matured stages of up move, with 17960 as important support and 18180 as hurdle.

All of the above methods are price and time focused and not derivative of it. So it is important for trader to use this simple yet powerful techniques and see transformation in the way they can trade. Trading should be fearless when you can see the future possible price action.

Mentorship on Timing – Early Bird ends in 2 days with benefits of Lifetime access to Bonus videos, discounted pricing ending soon! Time is now to become a profitable trader. Act now to take charge of your trading career. Fill the form here for more details - https://www.wavesstrategy.com/mentorship/

Wednesday, November 2, 2022

Bank Nifty - Will it Cross 42000 or Time to Get Cautious?

Bank Nifty has continued to inch higher along with Nifty but is it sustainable or time to book profits?

Elliott wave helps us to understand the overall maturity of trend. It is GPS of the market and we are applying it on Bank Nifty as shown below.

Following research is picked up from daily equity research report – The Financial Waves short term update

Bank Nifty daily chart

Bank Nifty hourly chart

Elliott wave analysis – As shown on daily chart we can see Bank Nifty is back towards the previous top made in August 2022. However, this rise is slower and we can see there is no strong trend as ADX is declining which indicates range bound move over medium term.

From Elliott wave perspective prices are moving in form of wave (e) of possible Neutral Triangle pattern as defined in Neo wave. This is usually the last leg of up move before a reversal happens from medium term perspective but price action is important.

Over short term, we can see that the rise is slower as compared to fall in form of wave a. This entire up move is possibly in form of double corrective pattern involving x wave. Channel support is at 40,000 and dips can be used to buy over short term for a move towards 41500 – 41800 levels.

In a nutshell, overall trend for Bank Nifty is up over short term but matured from medium term perspective. 42k is going to be major hurdle. On downside 40k is crucial support, as long as this level is intact one can buy on dips for target of 41500 – 41800 levels.

Elliott wave along with other technical analysis method can act as powerful trading system. This requires a Mentor who can handhold, guide, discuss as the pattern progresses.

3 Months of Mentorship on Timing the Markets – Learn to Time the market along with application of Time cycles, Neo wave and simple yet powerful trend following methods, stock selection Algos, Momentum stocks, Multibagger portfolio, risk and money management, Live Trading sessions, Options trading. All of this will be part of Mentorship with step by step approach to trade with high conviction, access to private Telegram group for lifetime, Early Bird Ends on 5th November, Fill the form here for more details - https://www.wavesstrategy.com/mentorshipoffer

Tuesday, November 1, 2022

Why #Mentorship on Timing the Market for Successful Trading?


Learn the science of Timing the market over more than 3 months with lifelong association, live trading sessions, Algo creation and everything focusing on Time trading, Register here - https://www.wavesstrategy.com/mentorship OR Contact us on +919920422202 

We would love to connect with you on Social Media:


----------------------------
"SEBI “Research Analyst” No: INH000001097
Write to us on : helpdesk@wavesstrategy.com 
Contact us: +91 9920422202 

Nifty Trade Setup, Momentum Stocks on @CNBC Awaaz. | Ashish Kyal


Nifty trade setup with key levels and stocks to trade discussed by stock market Expert Ashish Kyal, Author, CMT

Learn the science of Timing the market over more than 3 months with lifelong association, live trading sessions, Algo creation and everything focusing on Time trading, Register here - https://www.wavesstrategy.com/mentorship OR Contact us on +919920422202 

We would love to connect with you on Social Media:


----------------------------
"SEBI “Research Analyst” No: INH000001097
Write to us on : helpdesk@wavesstrategy.com 
Contact us: +91 9920422202 

Friday, October 14, 2022

Nifty Path ahead using Timecycle, Gann & Lunar


Master of Cycles (MOC) on 15th – 16th October 2022 (online). This is going to cover Hurst’s Time cycles, Identifying the Date, exact time when one can expect reversals in market, Lunar cycles, Gann square of 9. Do miss out this opportunity to learn about Timing the markets. Register here - https://www.wavesstrategy.com/mocoffer OR Contact us on +919920422202

We would love to connect with you on Social Media:


----------------------------
"SEBI “Research Analyst” No: INH000001097
Write to us on : helpdesk@wavesstrategy.com 
Contact us: +91 9920422202 

Thursday, October 13, 2022

Reliance – Time the entry to the Minute!

Reliance Industries has been following 87 period Time cycles on 15 minutes chart exceptionally well.

Time Cycles with Price action is the best combination in order to understand take the trades when the time is right.

Reliance Industries 15 minutes chart

Time cycle helps to understand when the time is right. In above chart we are showing 87 period Time cycles on a 15 minutes time frame. This clearly shows that every 87 period Reliance Industries turn on the upside giving a good trending move.

This can be combined along with simple Price action and Candlestick technique can simply be the most important trade setup one can get.

Many are focussing only on prices or indicators but not on time. If the time is not right then the breakouts will fail. It is therefore curcial to understand if the time is in favour.

In a nutshell, Reliance showed strong bounce from 2360 levels when the time was right and moved to 2390 levels. This move is good enough for Intraday traders. For bigger, moves one can use this technique on daily chart or higher time frames.

The technique of time can be applied across the stocks, commodity, currency markets for any time frame traders.

Master of Cycles – 2 Days to go for this science of Timing the market to the very Day, Hour and Minute. Learn to forecast price using Time which only a few are aware of. This technique can be the missing link to your accuracy. Do not miss this opportunity, Only a few seats left know more