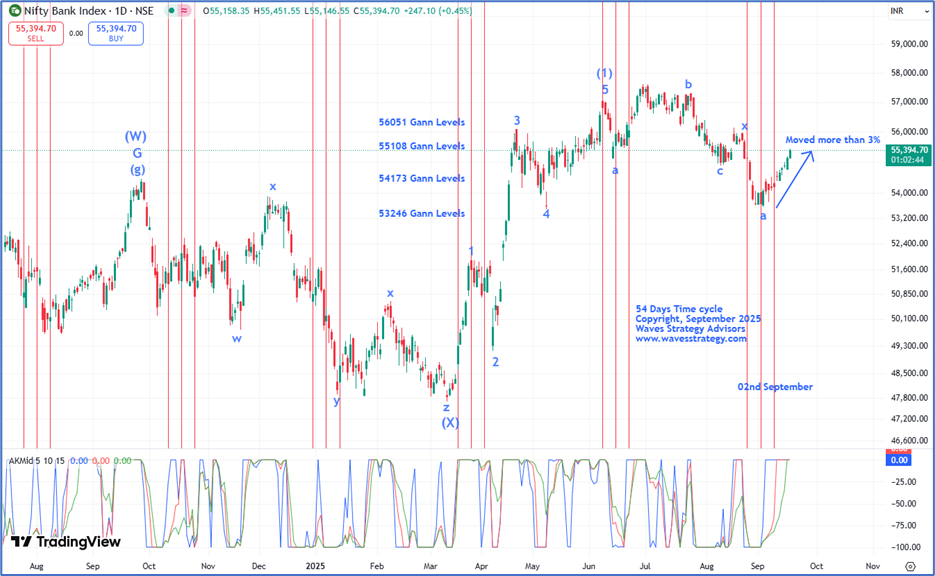
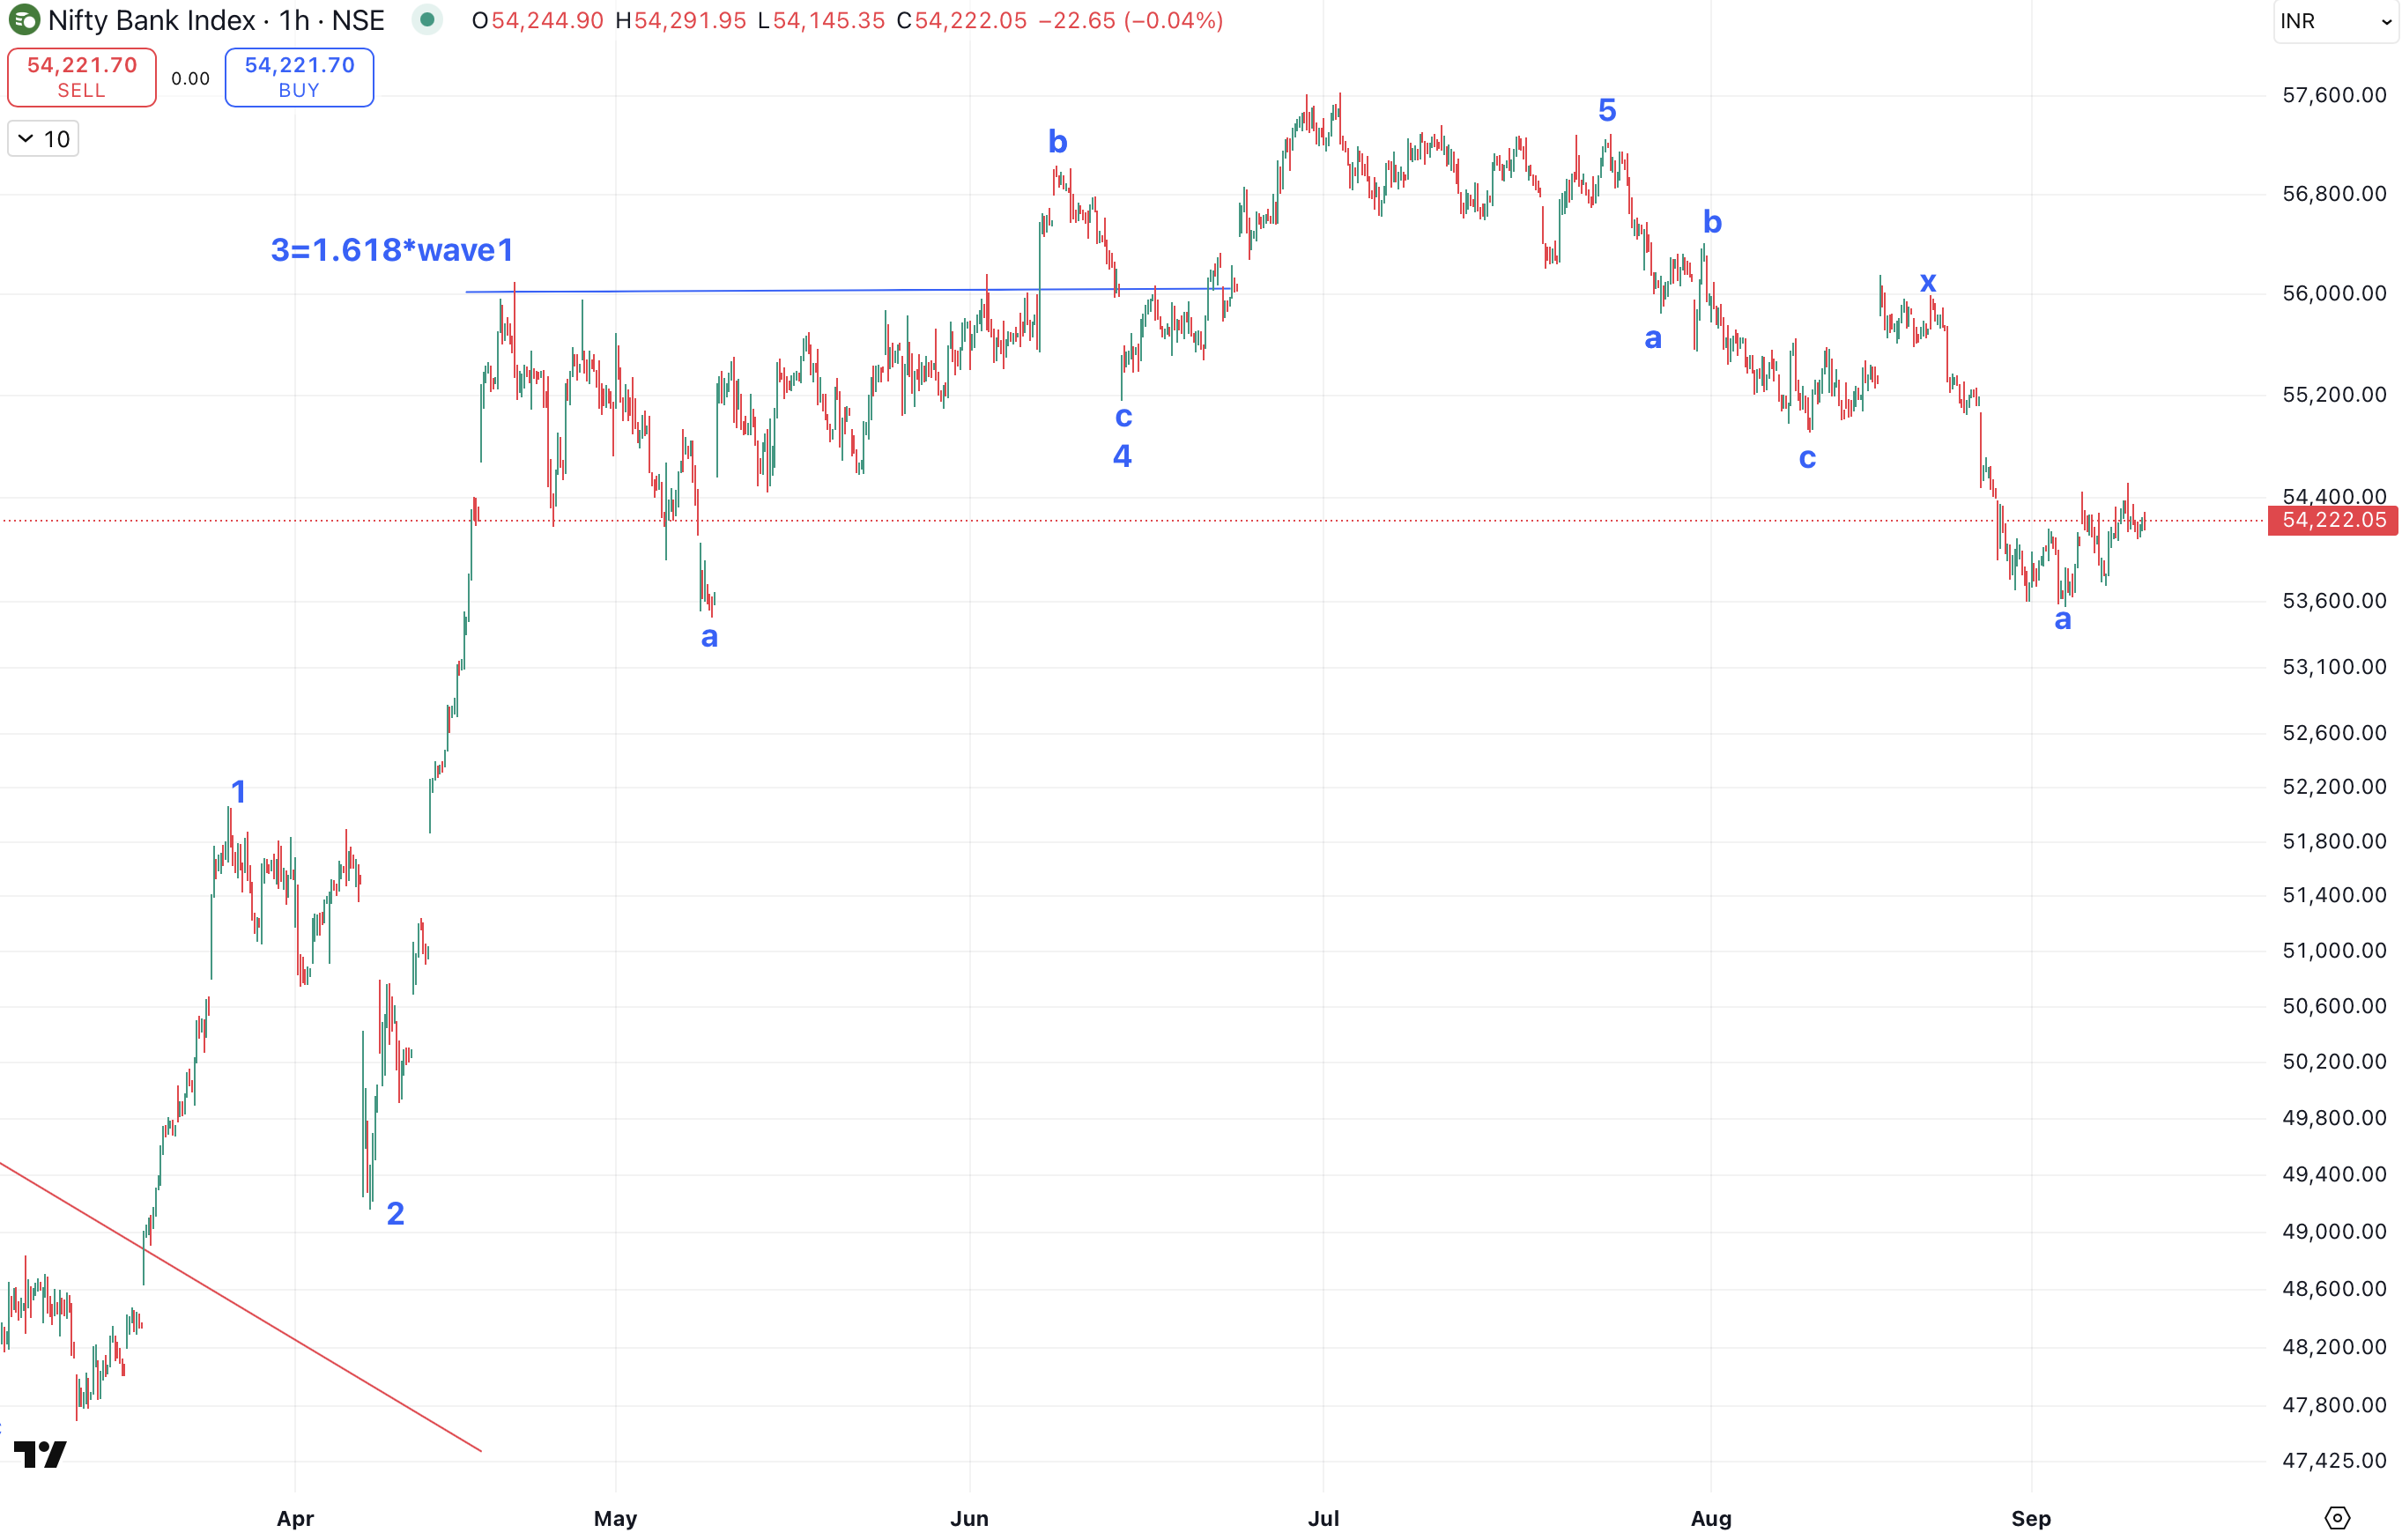
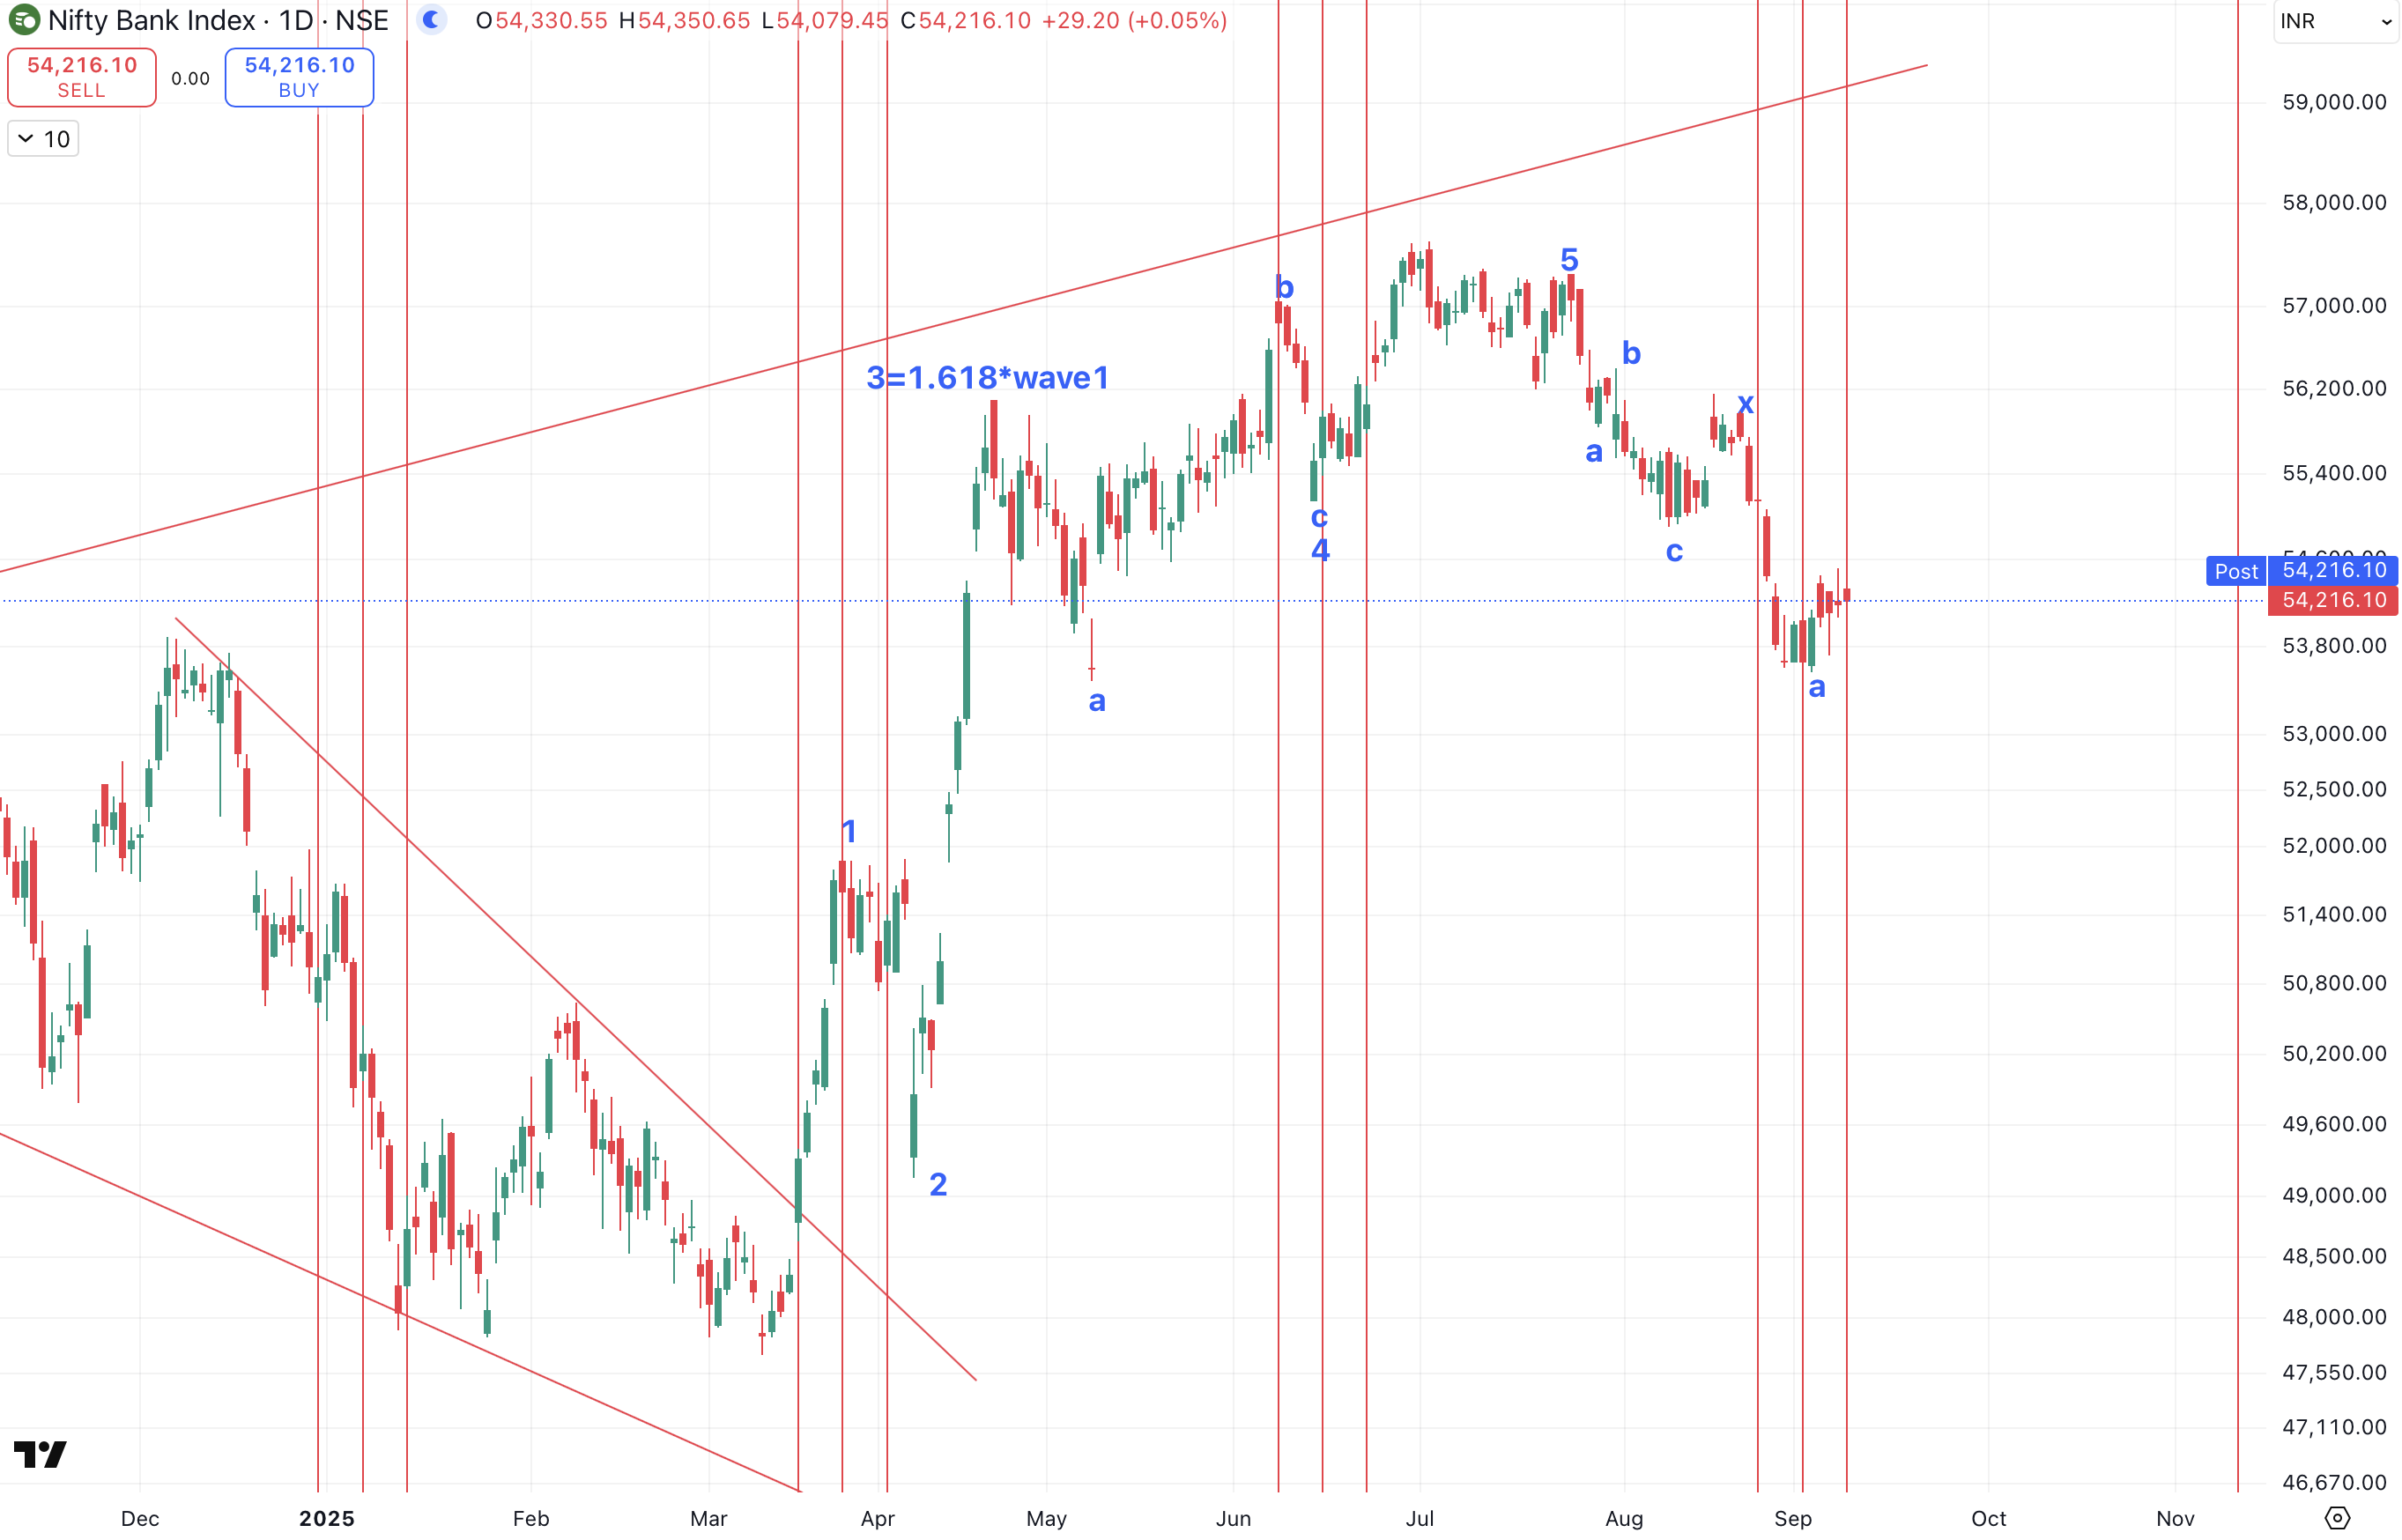
Nifty Daily chart with 55 Days Time cycle
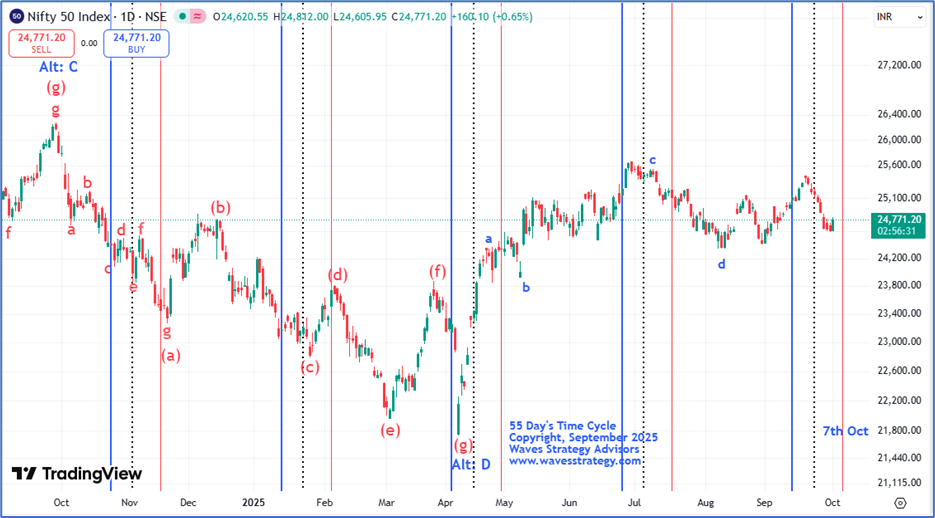
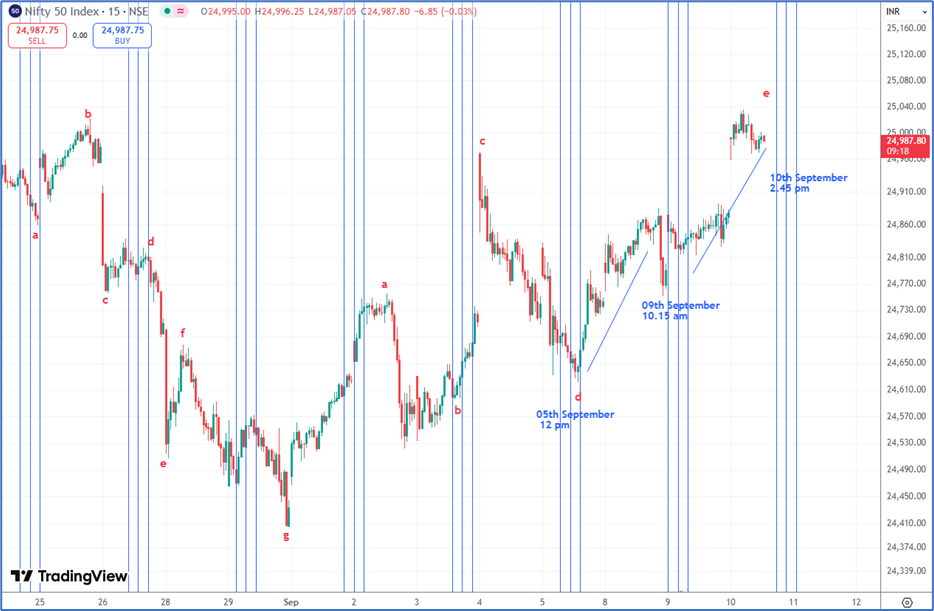
Nifty Gann level of 24728 has been acting like a magnet since past 3 trading days. In the previous session, Nifty made a low of 24587 levels and protected the support of 24580 levels which we have been talking about in our social handles like X(Twitter) and in today’s session Nifty gave a 15 mins close above 24728 levels.
Overall Nifty is at important juncture. On the weekly chart bigger Triangle looks to be under formation. On the daily chart, we are right now at the cusp of price action as we are trading close to the last thrust of the 55 Day’s Time cycle which is due on 07th October 2025. Positive upside reversal from hereon is expected if we get a confirmation as per 3 candlestick rules for which we need a low above prior day’s low, high above prior day’s high, close above prior day’s high.
In nutshell, Secret science of Gann level along with Hurst Time cycle and Neo wave are getting in sync again which you cannot miss this time! Ensure to maintain stoploss. These are simple ways to forecast and combining this with price action is very important. So, for now as long as price does not close below 24580 levels overall trend can change back on the upside.
3 months of Mentorship (Brahmastra) on Timing the market – Equip yourself with methods and techniques of Time cycles with Elliott wave patterns that actually work, Mentorship Day 1 on 08th October 2025 with only few seats left. Learn to derive targets, stoploss and time it to the very Day, Hour, and Minute. Few seats only. Know more here: