Thursday, April 27, 2017

Bank Nifty is at Life time highs: 3 most important techniques to ride the trend!

Understanding the trend of Bank Nifty with application of Elliott wave, Channels and Moving averages!

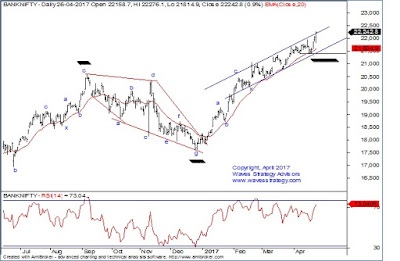
Nifty has shown spectacular rally in last 3 trading session and prices have moved higher from 9075 to 9366 levels. Based on the basic as well as advanced concepts of Technical analysis we were able to capture the up move and you can see detailed research here. In last 3 months Bank Nifty has moved higher from 17600 to 22250 level till now. Although the rally has been corrective in nature as per Elliott wave theory but it has managed to follow 3 most important techniques which helps to ride the trend as long as it goes. Below chart on Bank Nifty is taken from The Financial Waves Short Term Update  which was published in todays research before the market open.

3 Techniques to follow the trend of Bank Nifty:

20 Days Exponential moving average: Moving average is the simplest concept however one needs to check from Trial and error method that which MA is suiting well to prices. 20 days EMA is providing excellent support and recently prices reversed on upside from the same. Positional traders can use this EMA as risk management.

Channeling technique: Before initiating any positions, it is better to see on charts that which channel is working. Small blue upward moving channel as shown below in daily chart has played its role brilliantly and up move resumed when prices tested the channel support.

Bar technique: In the entire up move we have observed that as long as prices continues to protect the low of prior bars on closing basis, trend continued on upside. Whenever prices gave close below prior bars low, consolidation was witnessed.

Bank Nifty daily chart:
Bank Nifty,Elliott wave

(Part of research taken from today’s research)

Wave analysis:

Bank Nifty has continued to provide major support to the Nifty and this sub index is trading at the life time high. Let us look at the short to medium term structure of this index to understand the trend ahead.

The daily chart of Bank Nifty shows that prices have been respecting the short term upward moving channel. Recently prices made a low exactly at the channel support and then sharply moved higher towards the channel resistance. As per wave perspective, prices are in minor wave . of third standard correction pattern and from here on it will be crucial to see if it breaks the channel resistance or starts to move in consolidation. Till that time it is better to follow the bar technique. As per this technique as long as prior bars low is intact on downside trend will be positive. 20 days EMA is proxy for the same which is constantly providing support to the up move. Medium term support as per this MA is near 21380. Medium term investors in banking sector can use this EMA as risk management strategy.

(60 mins chart with Elliott wave is not shown here which is covered in research report)

In the last session high volatility was witnessed which was in lines with that observed on Nifty as well during the day but prices later managed to close near the high point of the day which will keep positive trend intact. As shown on hourly chart, prices are now near the upper end of the channel resistance. It is not very often to see break above the upward sloping trendline but given the steepness it is prudent to avoid catching a top and trading in direction of the trend. Any break of level will decisively break the channel resistance and suggests continuation of up move.

In short, Bank Nifty has immediate support at psychological ……. mark followed by ……… level. Move above . is required to extend this rally further as it is also the equality level for wave c with that of wave a.

These are some of the techniques which we follow to capture and ride the trend. However one should also understand that continuous research is the key to be successful in a market. It is crucial to understand the market dynamics so that one can keep himself ready with different techniques.

Subscribe to “The Financial Waves Short Term Update” which covers Nifty, Bank Nifty and 3 different stocks on daily basis using one of the most advanced and scientific approach to technical analysis using Elliott wave, Neo wave, Time cycles and much more. Nifty and Bank Nifty has behaved exactly as the way expected and it is not very often to see such high degree of accuracy. Get your copy NOW 
Wednesday, April 26, 2017

Contest Alert: Guess Nifty expiry!

#ContestAlert: At which levels will Nifty close on the day of Expiry (27th April -2017). Guess the closing levels of Nifty and the nearest guess wins Discounted Coupons.

Only one entry per user. No entries will be counted after 26th April -17; 11:59 PM


*T&C Apply

Tuesday, April 25, 2017

Nifty: Power of Gann square of Nine, Hurst’s Time cycles Anticipated & Happened!

Below research highlights - Understanding the trend of Nifty with application of Gann theory, Hurst time cycle combined with Neo wave.

Nifty has continued to be in Bulls radar and tested the new life time high of 9287.75 (@1.06pm) in today’s trading session. If we ignore the last 2 days of up move then in the entire month of April 2017 we have witnessed overlapping kind of down move from 9275 to 9075 level. However interesting thing is that entire movement of April 2017 which has happened till now is exactly as per the path shown in the research report. We predicted accurately the path of Nifty based on Advanced Technical concepts such Neo wave, Gann square of Nine price projection and Hurst Time cycles. Below we have shown proof of the same which is taken from “The Financial Waves Monthly Update” published on 4th April 2017.

Nifty daily chart: Gann square of Nine Price projection with Hurst’s Time cycles (Anticipated on 4th April 2017)
Nifty,Elliott wave
Nifty daily chart:  (Happened till now)
Nifty,Elliott wave

(Part of research taken from “The Financial Waves Monthly Update” published on 4th April 2017)

“Gann Square of Nine Price projections combined with Hurst’s Time : During complex patterns when the trend is strong we try to use different methods to get price and time projections. On Figure 5 we have applied Gann square of Nine price projections. This is applied by looking at 180 degrees on Square of Nine.

The below figure shows square of Nine method. Yellow highlighted area on the right side is the 0 degree and on the left side is 180 degrees. Since the price levels on Nifty we are looking at is nearly in range of 9000 the same cannot be shown here. But we have made excel projections with the entire cells till more than 10000 marked in the below fashion. Due to restriction of space the same cannot be shown here. So the price levels marked on Figure 5 is derived from the yellow region on the left side of x axis which is in series of 2, 11, 28, 53 etc. So if the reading continues you will come across 8327, 8696, 9073,… marked on above chart.

As per this logic since the level of 9073 is now broken decisively and prices managed to form higher highs and higher lows above this level the next level to look out for is at ….

Square of Nine:

Hurst’s Time cycles: We have taken a step forward to combine the above Gann method and apply it along with time cycles to see if we can time the turn. The path is shown on the chart based on channels and Time cycles. As per this we should see some pullback on downside towards the level of 9080 after one more push towards the channel resistance. This path is only tentative as Time cycles can lose its validity during strong trending moves.

Displaced cycle 55 days: Due to Demonetization and Trump victory on 9th November 2016, the cycles got little distorted. It is unclear as of now if the original cycle (red) is working or the displaced one (blue) is more important which is from the important lows. We are therefore going to use cycle analysis only with little caution unless further clarity is obtained.

Neo wave existing wave counts: As mentioned earlier looking at the sharp rise even above the high of 9219 there is a possibility that wave [E] is over in form of a running triangle pattern and next big up move has started. Nevertheless the rallies are going to be corrected by declines and sometimes sharp which will provide excellent opportunities to enter.

So for now prices are moving in form of wave …. of the up move as shown in Figure 4. Now as the rise has been in overlapping fashion without sufficient time correction it means that it is not a normal impulse but ……..

In a nutshell, looking at the overall trend so far the best strategy to follow is the weekly bar method. … Also as per Gann analysis method the next level to look forward to is ….which is lying on the 180 degree angle….Nifty can move as per the path shown ….”

Happened: Nifty is moving precisely as per the path shown on the chart on 4th April 2017. Post publishing of this research prices corrected from 9275 to 9075 level and protected 9073 level which was mentioned as per Gann square of Nine price projections. Along with this Time Cycle of 55 days also played a crucial role and prices made low near the same. Isn’t it a thrilling experience to see certain levels both in terms of Price and Time working so precisely?

SUBCRIBE NOW to “The Financial Waves Monthly Report” which covers different asset classes like Global Equity Markets, Commodities, Currency, Mutual Funds, etc. and published in the first week of the every month.  For daily updates on Nifty and 3 different stocks with Elliott wave theory subscribe to “The Financial Waves Short Term Update”  and trade with the help of Technical analysis! Subscribe daily equity research report annually - get 30% discount along with access to this Monthly research report Free for limited period. The predictability is very high and you can see it in above charts. Get your copy now

Thursday, April 20, 2017

How to trade Nifty using Indicators and Channels?


Subscribe NOW to the daily equity research report and get the Monthly research absolutely free over the period of 12 months. At times it is important to know the Elliott wave counts right from hourly charts to the monthly charts which give holistic perspective from trading to investments decisions! Get your copy NOW

How to trade Intraday - HDFC Ltd in Futures and Options?

Below research highlights on how did we generate intraday call for HDFC Ltd based on Elliott Wave, Channels, Moving average and Fibonacci retracement!

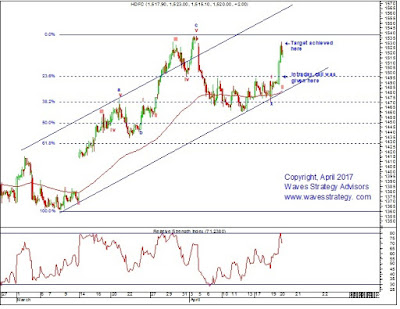
Nifty has continued to move in overlapping fashion from last few days however during the same time stock specific action has continued with strong momentum. This has been providing good opportunity for intraday traders. Below is the stock tip given on HDFC Ltd to our Intraday  / Positional calls subscribers. 

Below we have shown 60 mins chart of HDFC and the strategy we followed to give Intraday call in Futures as well as in Options to our subscribers:

HDFC FUT BUY AT CMP 1500 SL 1480 TGT 1530 – Time 9.26 AM when call was given

HDFC 1500 CE APR BUY AT CMP 14.60 SL 7 TGT 28  - Time 9.26 AM when call was given

HDFC 60 mins chart: (Anticipated)
HDFC, Elliott wave

HDFC 60 mins chart: (Happened)
HDFC,Elliott wave

Happened: In the above chart we can see that Elliott wave is helping to understand the overall trend along with Channels and Exponential Moving average of 100 periods playing important role. Based on this technical concept, we provided call to our subscribers and HDFC moved in lines with our expectation. Prices showed strong momentum on upside in form of minute wave iii and achieved our target level in first few hours of trading session.

This indicates that trading can be systematic if one applies and follow the objective methods of technical analysis. However one should also understand that stock market is a game of probabilities and hence one should follow strict risk management strategies. We advise our clients to trade in 2 lots in which we book partial profits in 1 lot and trail the other one to cost to fetch the maximum out of ongoing trend.

SUBSCRIBE NOW to Stock Tips on annual basis and get 30% discount. Also get access to the Equity daily research reports and Monthly research reports for Free that explains Elliott wave concepts in detail and various trading opportunities. Calls are given via Yahoo messenger / SMS/ What’s App with complete follow-up.

Wednesday, April 19, 2017

Stocks Tips LIC Hsg Fin, Bank of India, Commodity Tips for trading with charts!

Below is the transcript of Stock tips given by Ashish Kyal, CMT on ET Now.

LIC Housing Finance 60 mins chart:

LIC HOUSING FINANCE BUY ON DIPS TOWARDS 640 SL 625 TGT 665

This stock is intact in upward moving channel from last 2 months. Recently prices reversed from the channel support and moved higher with strong momentum. In an outperforming stock buy on dips is the ideal strategy which can provide favorable risk reward ratio. Along with this Elliott wave also suggests that rise witnessed in last few months is impulsive in nature where it becomes easy to spot the trading opportunities.

Bank of India 60 mins chart:

BANK OF INDIA BUY AT CMP 153.40 SL 147 TGT 162

PSU Bank sector has continued to outperform over last few months. Bank of India is in uptrend. 50 periods Exponential Moving average is providing important support and ideal zone to enter long positions. Along with this, 39 hours Time cycle is also helping to capture the short term bottoms.

Commodity Tips

Lead April 60 mins chart:

MCX LEAD SELL AT CMP 142.70 REST AT 142.30 SL 144.20 TGT 140-139 This call was given to our Commodity tips subscriber on 18th April based on the above techniques

Prices are intact within the downwards sloping blue channel and post touching the channel resistance in form of wave x it exhibited a sharp move on downside. As an important thing to notice is that wave x formed a pennant pattern and completion of the same indicated that the trend has resumed on downside.

Subscribe NOW to the Stock Tips and Commodity Tips and receive calls via SMS, What’s app, Yahoo Messenger with complete follow – up. Also get access to Free research reports and 1 hour of Elliott wave crash course if you subscribe for Equity or Commodity Intraday / Positional calls. Stocks and Commodities are showing very good trending moves. Subscribe NOW and we will set you up immediately.

Monday, April 17, 2017

How to trade Commodities Neo wave pattern?

Application of Advanced Technical analysis on base metals like Zinc to understand the short to medium term trend.

Technical analysis can be applied on any asset class. There are number of forecasting theories which helps to understand the trend ahead. Advanced level of Elliott wave - Neo wave has specified certain new patterns such as - Extracting Triangle, Neutral Triangle, Diametric pattern which is not covered in Elliott wave theory.

Base Metals have been moving higher in corrective fashion since 2009. The pattern forming from 2009 on MCX Zinc weekly chart is Diametric pattern where we can see contraction followed by expansion. The part of research is taken from “The Commodity Waves Short Term Update” published on 13th April 2017.

Plot your own charts on commodities Zinc Futures (draw line chart) and share it across on our Trader’s Forum for collaborative learning or clarifying your doubts or sharing something extremely exciting with everyone.

MCX Zinc Weekly chart: Following chart is picked up from “The Commodity Waves short term update”

Wave analysis:

Below research is picked up from the daily commodity update“The Commodity Waves short term update”

“As shown in weekly chart, since 2009 primary wave B is ongoing which is forming Diametric pattern – this is a classical text book mirror image which is given in Neo wave studies. The sharp trend witnessed from the start of 2016 is in form of intermediate wave g which is the last leg of the pattern. This wave g is forming double correction pattern where minor wave (b) of second correction  is ongoing. As per this wave structure one more leg on upside is pending in form of wave (c). Nevertheless over short term there is no positive confirmation and downside trend can continue before forming low in form of wave (b).

As shown in 60 mins chart, (60 mins chart is not shown purposely which is covered in research report) prices are in wave (v) of minute wave c. The down move has been sharp in nature which indicates any rallies is going to be short lived as long as …….

To know the trading strategy, Subscribe NOW to “The Commodity Waves Short Term Update” which covers Gold, Silver, Crude, Copper on regular basis and Lead, Zinc, Natural Gas periodically. Use the wave theory for forming intraday trading strategies on commodities to capture the trend.
Subscribe for Commodity Tips and get research reports absolutely free. Subscribe annually and get 30% discount with Monthly research report absolutely free. Gold / Silver has been in a good trend on upside and we will provide tips on your mobile via sms / whatsapp / yahoo messenger. Learn as you trade!

Friday, April 14, 2017

Webinar: How to trade Nifty in coming week using Bollinger Bands?


Subscribe NOW to the daily equity research report and get the Monthly research absolutely free over the period of 12 months. At times it is important to know the Elliott wave counts right from hourly charts to the monthly charts which give holistic perspective from trading to investments decisions! Get your copy NOW

Wednesday, April 12, 2017

Nifty: Power of Hurst’s Time cycles along with Neo wave Diametric pattern!

Nifty: Power of Hursts Time cycles along with Neo wave Diametric pattern!

Time cycles are extremely important concept and when combined with other technical analysis methods it gives high probable outcome.

Below research shows how we are using Hursts Time cycles with Neo wave application on Nifty.

This time we are again visiting 55 days Time Cycle which has worked well in past. We found out this cycle based on Hurst cycle study which has predefined standard cycles. One can find cycles which are close to the nominal ones defined in the nature.  This cycle had been working well over the past history.

In cycle analysis one should give leeway of 10% as Time is more dynamic element compared to price. Low formed on Demonetization was just 2 days later when the cycle was bottoming out.

Plot your own charts with cycle analysis on Nifty and share it across on our Trader’s Forum for collaborative learning or clarifying your doubts or sharing something extremely exciting with everyone.

Below chart is picked up from the daily equity research report The Financial Waves short term update that covers view on Nifty and three different stocks published daily.

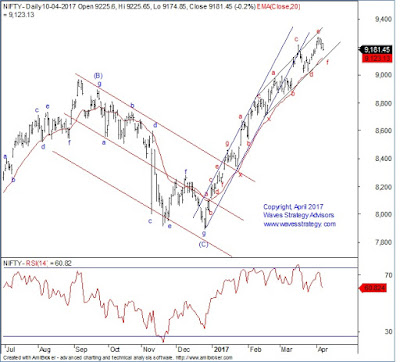
Nifty daily chart:

Nifty,Elliott wave,Technical Analysis,Diametric Pattern,Neo wave

Wave analysis:

Published today morning in equity research report

Nifty had a flat opening in yesterday’s session and prices managed to quickly move towards 9240 on upside during first half of the session. Later there was consolidation throughout the day within a narrow range of 9220 and 9240 levels. Stock specific action continued with heavy weights like ICICI Bank, ITC, Bank of Baroda helping index to close positive.

As shown on daily chart, over past 4 days Nifty corrected by hardly 100 points and recovered back quickly on upside in just one day. The broader market has been still outperforming during this period. It therefore indicates that the ongoing leg is only wave f and post its completion wave g on upside should start.

We are showing 55 days Time cycle on the daily scale. As per this cycle an important low should be formed by ……… April. The reason for giving a range is because we do not have precise level to pick up post the Demonetization. The cycles got little distorted and so we will use the range rather than picking up exact low date. This time as well prices moved in sideways action in the cycle topping zone rather than downside so far. This is in sync with the existing wave counts.

As shown on hourly chart, (shown in the actual research report) after the fall and rise scenario the best tool to use is Bollinger Bands for directional breakout confirmation. Nifty made a high near 9245 levels which was exactly at the upper end of the bands. The lower end of the band is near 9170. We can expect range bound action between this zone over next few days before the time cycles are behind us and prices confirm a low formation by …… above the high of …….. levels.

Nifty has moved precisely within the zone mentioned in today’s morning research report…

Subscribe NOW to the daily equity research report and get the Monthly research absolutely free over the period of 12 months. At times it is important to know the Elliott wave counts right from hourly charts to the monthly charts which give holistic perspective from trading to investments decisions!

Tuesday, April 11, 2017

Nifty - Neo wave Diametric pattern and path ahead!

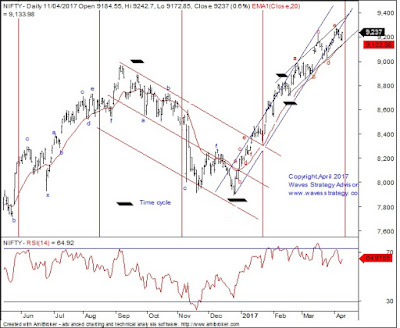
Bottom Line: Nifty moved lower in yesterday’s session as well but is now approaching close to the important channel support.

Nifty daily chart:
Nifty,Elliott wave,Neo wave, Diametric Pattern

Nifty 60 mins chart:
Nifty,Elliott wave,Neo wave,Diametric Pattern

Wave analysis:

Nifty continued to trade negative yesterday after opening positive near 9220 levels. The move on downside has continued but prices are now approaching near the important channel support. Fall in Sensex was more intense with prices moving down by 130 points and top contributor to the down move was Infy followed by Reliance Industries.

As shown on daily chart, RSI has already started showing negative divergence thereby confirming the outcome which we saw using other parameters like Moving Average difference oscillator shown few days earlier. From daily trading perspective it is best to follow bar technique. For trend to reverse we require close above previous bar high which is near 9226.

Nifty fall has been in overlapping fashion so far and the intensity is yet to be seen. This confirms that the overall pattern developing in the third pattern is extending further in the form of a Diametric pattern. The high made at 9274 was exactly at the channel we have been showing that completed wave e of Diametric and now the fall is in the form of wave f. Diametric patterns are 7 legged corrections with each leg moving in overlapping fashion. This is the reason why the momentum is not strong during the fall so far. There is a possibility that the channel can be whipsawed.


The short term support is near 9140 followed by 9080. Yesterday’s fall managed to protect this level so far. Let us see if there is attempt to protect the channel zone. Always remember that for strong uptrend to reverse series of negative price confirmations are important. Also there is zone of support between 9080 – 9140 levels. So, strong momentum below these levels is required for medium term reversal. Until that happens we can expect prices to drift lower but open up positive trend again towards higher levels near 9458 which is derived using Gann analysis on medium term charts and shown in the recently published Monthly update as it covers medium to long term perspective on global indices.

In short, trend for Nifty is negative unless we see a close above 9225 levels. Corrections in stocks are also overlapping so far which suggests that one leg on upside is possible after completion of wave f with 9080 – 9140 zone as very important support!

The above research clearly shows that if one follows the objective technical tools then probability of success in trading can increase. To capture such moves subscribe to “The Financial Waves Short Term Update” for 12 months and get access to “The Financial Waves monthly update” absolutely FREE in which we have shown path for Nifty from medium term perspective and it has moved exactly the way as expected. Simply make the payment from here and we will send your copy of both the reports. Under Notes mention the promo code – WSAMonthlyoffer. Markets are moving precisely as per pattern expected. Do not miss the opportunity when the probability of success is very high! Subscribe NOW