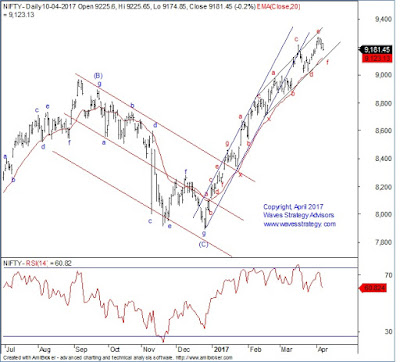
Bottom Line: Nifty moved lower in yesterday’s session as
well but is now approaching close to the important channel support.
Nifty daily chart:
Nifty 60 mins
chart:
Wave analysis:
Nifty continued to
trade negative yesterday after opening positive near 9220 levels. The move on
downside has continued but prices are now approaching near the important
channel support. Fall in Sensex was more intense with prices moving down by 130
points and top contributor to the down move was Infy followed by Reliance
Industries.
As shown on daily
chart, RSI has already started showing negative divergence thereby confirming
the outcome which we saw using other parameters like Moving Average difference
oscillator shown few days earlier. From daily trading perspective it is best to
follow bar technique. For trend to reverse we require close above previous bar
high which is near 9226.
Nifty fall has been in overlapping fashion so far and the intensity is yet to
be seen. This confirms that the overall pattern developing in the third pattern
is extending further in the form of a Diametric pattern. The high made at 9274
was exactly at the channel we have been showing that completed wave e of
Diametric and now the fall is in the form of wave f. Diametric patterns are 7
legged corrections with each leg moving in overlapping fashion. This is the
reason why the momentum is not strong during the fall so far. There is a
possibility that the channel can be whipsawed.
The short term
support is near 9140 followed by 9080. Yesterday’s fall managed to protect this
level so far. Let us see if there is attempt to protect the channel zone.
Always remember that for strong uptrend to reverse series of negative price
confirmations are important. Also there is zone of support between 9080 – 9140
levels. So, strong momentum below these levels is required for medium term
reversal. Until that happens we can expect prices to drift lower but open up
positive trend again towards higher levels near 9458 which is derived using
Gann analysis on medium term charts and shown in the recently published Monthly
update as it covers medium to long term perspective on global indices.
In short, trend for
Nifty is negative unless we see a close above 9225 levels. Corrections in
stocks are also overlapping so far which suggests that one leg on upside is
possible after completion of wave f with 9080 – 9140 zone as very important
support!
The above research
clearly shows that if one follows the objective technical tools then
probability of success in trading can increase. To capture such moves subscribe
to “The Financial Waves Short Term Update” for 12 months and get
access to “The Financial Waves monthly update” absolutely FREE
in which we have shown path for Nifty from medium term perspective and it has
moved exactly the way as expected. Simply make the payment from here
and we will send your copy of both the reports. Under Notes mention the promo
code – WSAMonthlyoffer. Markets are moving precisely as per pattern
expected. Do not miss the opportunity when the probability of success is very
high! Subscribe NOW


No comments:
Post a Comment