Understanding
the trend of Bank Nifty with application of Elliott wave, Channels and Moving
averages!
Nifty has shown
spectacular rally in last 3 trading session and prices have moved higher from
9075 to 9366 levels. Based on the basic as well as advanced concepts of
Technical analysis we were able to capture the up move and you can see detailed
research here. In last 3
months Bank Nifty has moved higher from 17600 to 22250 level till now. Although
the rally has been corrective in nature as per Elliott wave theory but it has
managed to follow 3 most important techniques which helps to ride the trend as
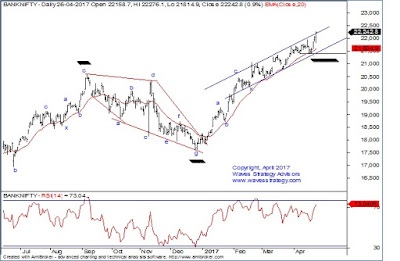
long as it goes. Below chart on Bank Nifty is taken from “The Financial Waves Short Term Update” which was published in today’s research
before the market open.
3 Techniques to follow the trend
of Bank Nifty:
20 Days Exponential moving
average: Moving average
is the simplest concept however one needs to check from Trial and error method
that which MA is suiting well to prices. 20 days EMA is providing excellent
support and recently prices reversed on upside from the same. Positional
traders can use this EMA as risk management.
Channeling technique: Before initiating any
positions, it is better to see on charts that which channel is working. Small
blue upward moving channel as shown below in daily chart has played its role
brilliantly and up move resumed when prices tested the channel support.
Bar technique: In the entire up move we have
observed that as long as prices continues to protect the low of prior bars on
closing basis, trend continued on upside. Whenever prices gave close below
prior bars low, consolidation was witnessed.
Bank Nifty daily chart:
(Part of research taken
from today’s research)
Wave analysis:
Bank Nifty has continued to provide major support to
the Nifty and this sub index is trading at the life time high. Let us look at
the short to medium term structure of this index to understand the trend ahead.
The daily chart of Bank Nifty shows that prices have
been respecting the short term upward moving channel. Recently prices made a
low exactly at the channel support and then sharply moved higher towards the
channel resistance. As per wave perspective, prices are in minor wave …. of third standard correction pattern and from here on it will be
crucial to see if it breaks the channel resistance or starts to move in
consolidation. Till that time it is better to follow the bar technique.
As per this technique as long as prior bars low is intact on downside trend
will be positive. 20 days EMA is proxy for the same which is constantly
providing support to the up move. Medium term support as per this MA is near
21380. Medium term investors in banking sector can use this
EMA as risk management strategy.
(60 mins chart with Elliott wave is not shown here
which is covered in research report)
In the last session high volatility was witnessed
which was in lines with that observed on Nifty as well during the day but
prices later managed to close near the high point of the day which will keep
positive trend intact. As shown on hourly chart, prices are now near the upper
end of the channel resistance. It is not very often to see break above the
upward sloping trendline but given the steepness it is prudent to avoid
catching a top and trading in direction of the trend. Any break of … level will decisively break the channel resistance and suggests
continuation of up move.
In short, Bank Nifty has immediate support at
psychological ……. mark followed by ……… level. Move above …. is required to extend this rally further as it is
also the equality level for wave c with that of wave a.
These are some
of the techniques which we follow to capture and ride the trend. However one
should also understand that continuous research is the key to be successful in
a market. It is crucial to understand the market dynamics so that one can keep
himself ready with different techniques.
Subscribe to “The Financial Waves Short Term Update” which covers Nifty, Bank Nifty and 3 different stocks on daily basis using
one of the most advanced and scientific approach to technical analysis using Elliott wave, Neo wave, Time cycles and much more. Nifty and Bank
Nifty has behaved exactly as the way expected and it is not very often to see
such high degree of accuracy. Get your copy NOW


No comments:
Post a Comment