Below research highlights on how did we generate intraday
call for HDFC Ltd based on Elliott Wave, Channels, Moving average and Fibonacci
retracement!
Nifty has continued to move in overlapping fashion from last
few days however during the same time stock specific action has continued with
strong momentum. This has been providing good opportunity for intraday traders.
Below is the stock tip given on HDFC Ltd to our Intraday / Positional calls subscribers.
Below we have shown 60 mins chart of HDFC and the strategy
we followed to give Intraday call in Futures as well as in Options to our
subscribers:
HDFC FUT BUY AT CMP 1500 SL 1480 TGT 1530 – Time 9.26 AM when call was
given
HDFC 1500 CE APR BUY AT CMP 14.60 SL 7 TGT 28 - Time 9.26 AM when call was given
HDFC 60 mins chart:
(Anticipated)
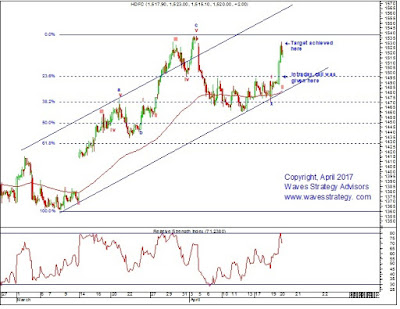
HDFC 60 mins chart:
(Happened)
Happened: In the above
chart we can see that Elliott wave is helping to understand the overall trend
along with Channels and Exponential Moving average of 100 periods playing
important role. Based on this technical concept, we provided call to our
subscribers and HDFC moved in lines with our expectation. Prices showed strong
momentum on upside in form of minute wave iii and achieved our target level in
first few hours of trading session.
This indicates that trading can
be systematic if one applies and follow the objective methods of technical
analysis. However one should also understand that stock market is a game of
probabilities and hence one should follow strict risk management strategies. We
advise our clients to trade in 2 lots in which we book partial profits in 1 lot
and trail the other one to cost to fetch the maximum out of ongoing trend.
SUBSCRIBE NOW to Stock Tips on annual basis and get 30%
discount. Also get access to the Equity daily research reports and Monthly
research reports for Free that explains Elliott wave concepts in detail and
various trading opportunities. Calls are given via Yahoo messenger / SMS/ What’s App with complete follow-up.


No comments:
Post a Comment