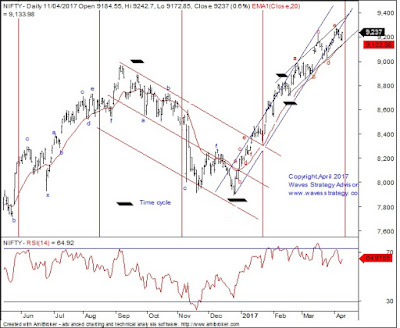
Nifty: Power of Hurst’s Time cycles along with Neo wave Diametric pattern!
Time cycles are
extremely important concept and when combined with other technical analysis
methods it gives high probable outcome.
Below research
shows how we are using Hurst’s Time cycles with Neo wave
application on Nifty.
This time we
are again visiting 55
days Time Cycle which has worked well in past. We found out this cycle based on Hurst
cycle study which has predefined standard cycles. One can find cycles which are
close to the nominal ones defined in the nature. This cycle had been working well over the past
history.
In cycle
analysis one should give leeway of 10% as Time is more dynamic element compared
to price. Low formed on Demonetization was just 2 days later when the cycle was
bottoming out.
Plot your
own charts with cycle analysis on Nifty and share it across on our Trader’s Forum for collaborative learning or clarifying your doubts or sharing
something extremely exciting with everyone.
Below chart is
picked up from the daily equity research report – The Financial Waves short term update that covers view on Nifty and
three different stocks published daily.
Nifty daily chart:
Wave analysis:
Published
today morning in equity research report
Nifty had a flat opening
in yesterday’s session and prices managed to quickly move towards 9240 on
upside during first half of the session. Later there was consolidation
throughout the day within a narrow range of 9220 and 9240 levels. Stock
specific action continued with heavy weights like ICICI Bank, ITC, Bank of
Baroda helping index to close positive.
As shown on daily chart,
over past 4 days Nifty corrected by hardly 100 points and recovered back
quickly on upside in just one day. The broader market has been still
outperforming during this period. It therefore indicates that the ongoing leg is
only wave f and post its completion wave g on upside should start.
We are showing 55 days Time cycle on the daily scale. As per this cycle an
important low should be formed by ……… April. The reason for giving a range is
because we do not have precise level to pick up post the Demonetization. The
cycles got little distorted and so we will use the range rather than picking up
exact low date. This time as well prices moved in sideways action in the cycle
topping zone rather than downside so far. This is in sync with the existing
wave counts.
As shown on hourly
chart, (shown in the actual
research report) after the fall and rise scenario the best tool to use is Bollinger
Bands for directional breakout confirmation. Nifty made a high near 9245 levels
which was exactly at the upper end of the bands. The lower end of the band is
near 9170. We can expect range bound action between this zone over next few
days before the time cycles are behind us and prices confirm a low formation by
…… above the high of …….. levels.
Nifty has moved precisely within the zone mentioned in today’s morning
research report…
Subscribe NOW to the daily equity research report and get the Monthly research
absolutely free over the period of 12 months. At times it is important to know
the Elliott wave counts right from hourly charts to the monthly charts which
give holistic perspective from trading to investments decisions!


No comments:
Post a Comment