Thursday, May 26, 2016

Elliott wave applied on Mutual funds Invest online!

L&T India Prudence Growth is an open ended scheme launched in January 2011.
This belongs to a Balanced category as the fund has exposure of 66% to Equity and remaining in debt and Cash / Call instruments. The fund is ranked 1 in large cap category by Crisil. L&T Mutual Fund is one of the fund houses that are accepting investments for US / Canada based NRI. You can get detailed research on the below mentioned funds by writing to us at helpdesk@wavesmf.com or fill the form at Contact US.

L&T India Prudence Growth Fund – daily chart

Portfolio Analysis: As per the sectoral holdings Banking/Finance have been most favored sector for this fund as it is contributing nearly 14.31% to the entire portfolio followed by Technology and Pharma Sector.

Top Holdings and Sector Allocation for this fund are shown below:

Top 5 Holdings:
Company
% Assets
Infosys
4.55
ICICI Bank
3.21
ITC
2.84
HDFC Bank
2.83
Sun pharma
2.33

Sector Allocation

Sector
%
Banking/Finance
14.31
Technology
 7.49
Engineering
 4.88
Pharmaceuticals
 4.86
Cement
 4.81


Returns as on 18th April, 2016
Performance
Fund
1 Year
3.28
3 Year
19.34
5 Year
14.31


Risk Profile: This fund has around 65% exposure to Equity and rest to debt. So this is a well placed fund who wants to take medium risk and given the current market condition it is very well positioned by diversifying risk into Equity & Debt.

Technical Perspective: The daily chart for L&T India Prudence Fund shows impulsive rise in form of 5 waves from August 2013. The most basic concept of Elliott wave suggests that in order to understand the trend one has to see if the movement is in 5 waves or corrective fashion. An impulsive move since 2013 indicates that the major trend of this fund is on upside and prices are currently correcting this up move in 3 waves. Post the completion of the correction that is currently ongoing the major degree uptrend should resume.

Investment Perspective: Corrections will offer good opportunity to ride the next strong uptrend post its completion. It is prudent to invest in this fund in form of SIP to capitalize on the down move as and when it happens. Impulsive move on upside clearly suggests that the long term trend is positive and over short term the correction is probably complete around 17.5 levels. However for lump sum investments we need to wait for the price confirmation which we will get on move above 20.5 levels. Until then it is best to invest in form of SIP and we will highlight it here as soon as strong upside reversal is in near vicinity!

Reach out to us to get Free Expert Advisory, Weekly Research Reports, Monthly Account Statements, Online Portfolio Management and much more User-Friendly Services.

Where to invest now? - Mutual Funds

Based on Elliott wave model we try to identify not only the asset but also the sectors that can probably outperform in future. Based on Inter-market analysis, Sector rotation, Interest rate and Economic cycle we identify Mutual Fund schemes that can be the leaders from three to five years time frame rather than only relying on the past performance. For Mutual Fund Investments Contact US.

Wednesday, May 25, 2016

Time cycle of 54 days, Neo wave and Bollinger Bands® does the magic again!

Nifty had a huge Gap up opening and prices have taken out the level of 7820 as of now.
This might have been a big surprise for traders expecting market to move below 7680 levels. Also the credit of strong rise will be given to positive Global markets and strong close by US Equity index – DJIA. Simply think if we were so highly correlated with US markets then DJIA is trading near its life time highs and we are still nearly 15% below the highs.

Time cycles play very important role in order to understand if sentiments are about to change. Everything in the world is governed by Time and so does stock market. Look at the below 54 days Time cycle which we have mentioned about few weeks back itself and prices formed low very close to it. However, Time can be a tricky element and it is important to use other techniques like Neo wave – Advanced Elliott wave, Bollinger Bands to identify the key support area and for price confirmation as well.

Nifty daily chart with application of Elliott wave, Time cycles and Bollinger Bands


On 23rd May morning research report “The Financial Waves short term update” we mentioned the following:
Time cycle of 54 days is also due today which is normally a bottoming cycle. This cycle worked exceptionally well during the downtrend from 9119 to 6825 levels. However, as prices have broken above the channel for first time since the top of 9119 there is possibility that the cycle might change. However, today being the 54th cycle day we will closely observe if the buying interest starts generating from here on.

On 24th May morning research report following was mentioned:
Application of Bollinger Bands: The daily structure of Nifty suggests that prices are moving within the band and currently it is approaching towards the lower support area of Bollinger bands. Still there is no strong momentum as the band is intact and prices have not entered the downward sloping channel

On 25th May morning research report following was mentioned:
Application of Neo wave pattern: As shown on daily chart the rise from 29th February 2016 onwards is in double corrective pattern and prices are now in second correction. The high of 7992 and low of 7678 has been protected for many weeks now and there is a clear contraction with no trending move in either direction. The basic two patterns that exhibit such behavior is either a triangle or a 7 legged Diametric pattern which has first half as contraction and the second half as expansion. Prices are currently in wave d and post its completion we should start seeing wave e on upside. ……..For now, one can create long positions if Nifty manages to close above 7820 for a move towards ……. levels initially. A strong momentum above this level will open up further positive possibilities. On downside ………… is going to act as short term support..

Analyzing complex corrective pattern is not always easy and it requires combination of different techniques to be on the right side of the trend.

Subscribe NOW to the daily research report “The Financial waves short term update” that covers detailed Elliott wave, Time cycles, Bollinger Bands and other techniques applied on Nifty, Bank Nifty, stocks. For subscription visit Pricing Page.

Attend one of the most advanced training on Elliott wave, Neo wave in combination with Time cycles and application of all the above techniques. Also training will focus on methods used during the trade show on ET Now that helped me to outperform other contestants and gain nearly 9.11% in just one week! For more details about the training visit: Most advanced technical training details

Monday, May 23, 2016

Invest in Mutual Funds online with suggested asset allocation! Axis long term Equity fund

Mutual Funds Investment redefined! 

Looking at the funds that has potential to outperform in future and not just looking at the past performance. We use Elliott wave theory to understand Mutual Funds possible outcome.

Invest Online by visiting Waves MF Advisors

Axis Long Term Equity Fund – Growth Daily Chart 


Axis Long Term Equity Fund –Growth is an open ended Equity Linked Saving Scheme [ELSS] which has a lock in period for 3 years.

Taxation: This fund aims for “SHARE LESS SAVE MORE”. This fund helps the investors to get tax rebates under section 80 C of Income Tax Act.

Portfolio Analysis: The major holdings of this fund are into Banking and Automotive sectors. Below is the table shown of Sectorial allocation of this fund.

Sector
%
Banking/Finance
29.66
Automotive
13.23
Pharmaceuticals
10.65
Technology
 8.90
Chemicals
 7.00
Engineering
 6.66

Returns: In past the fund has provided with following returns.

Returns as on 10th May, 2016
Period
Returns (%)
1 year
0.55
3 year
25.21
5 year
            19.71

Risk: This fund has concentrated exposure to sectors and so the risk is high. Also we are seeing loss of momentum on upside which is a caution sign. Fresh investments should be done in form of SIP only with time horizon of three years or more.

Technical Perspective: As shown in daily chart for this fund NAV gave triangle breakout in 2014 thereby completing intermediate wave [IV] near 13.97 levels and post that we can witness next wave on upside in the form of intermediate wave [V]. The first leg of this wave [V] is complete and we can now expect sideways to negative movement for few months before the next leg resumes on upside.

Investment rationale: Axis Long Term Equity ELSS scheme can move in sideways to negative action over near term. Faster move above 32.50 will indicate that next bull trend in this fund has started which will create wealth for investors. On downside 25-26 will continue to act as important zone.

Waves MF Advisors provide unbiased select basket of Mutual Funds that have potential to outperform within the given risk parameter. For investments into Mutual Funds with online portfolio and research contact us at helpdesk@wavesmf.com or call us on +91 22 28834540 / +9920922639 or visit www.wavesmf.com


Thursday, May 19, 2016

Is assembly elections 2016 outcome already discounted by Equity markets?

Assembly elections 2016 counting is still ongoing but markets are still stuck in a range. There is no trending move for many weeks now and it seems the news is already discounted.

I distinctly remember the euphoria created before the central elections outcome in 2014, Nifty formed a low near 5118 levels in August 2013 a whole 8 months prior to the election outcome. On the Election Day Nifty in fact touched the high of 7563 on 16th May 2014 – election outcome before reversing back and entering into red territory momentarily. This has been clear reflection that the event outcome was already discounted way before and surprisingly such landslide victory by BJP that no one would have imagined resulted into non-event when Nifty turned flat even though only for brief moment.

Case in point is forecasting the movement of Equity markets after the news or event is like walking blind folded. State Elections results will surely result into short term spike or volatility probably a random movement but eventually the original trend or pattern will resume its course.

We at Waves Strategy Advisors, believe that markets are patterned and follow a rhythmic path determine by Elliott wave. Also everything is governed by natural laws and so market also follows Time cycles that is integral part every creation.

Now look at the below chart of Nifty along with forecast done on 12th May 2016 morning research report “The Financial Waves short term update” before equity markets opened:

Nifty 60 mins chart:

Nifty 60 mins chart: Happened so far

The first chart of Nifty was shown on 12th May 2016 even before equity markets opened and we mentioned that following:

In short, yesterday’s volatile move has not changed the structure so far and prices have managed to protect the important support areas. A spike high or low act as important levels and so move above  7900 is crucial to resume up move towards …….. Slow drift with lack of momentum will further confirm our assumption of Ending diagonal pattern. Nifty can follow the path as shown on above chart!

Happened: It had been a week earlier we have showed the path of Nifty with very clear pattern description of Ending Diagonal structure. Prices have behaved very closely to the path so far and have exhibited perfect wave characteristics. Such movement has happened irrespective of the Mauritius Tax treaty even or the state election outcome. Now you decide yourself if markets really depend on external factors or Are already discounting the Elections outcome?

“The Financial Waves short term update” is a daily research report that contains detailed Elliott wave counts on Nifty, Bank Nifty and stocks along with applied technical tools and explanation. Markets do not move randomly but in predictable patterns that can help us making right trading decisions! Know more on how to get accessto this research report HERE!

Monday, May 16, 2016

How to select stocks for Intraday trading using Elliott wave, Momentum, Fibonacci levels?

Below are the few key pointers I personally followed during the ET Now stock trading game that helped me to win by substantial margin.

Understanding trend using Elliott wave, Neo wave, Time cycles: First and most important thing is to analyze the direction of Nifty and the broader market along with maturity of ongoing trend. To do this I used Elliott wave, Neo wave and other advanced technical analysis concepts for confirmation and maturity of the trend.

Avoid looking at overbought or oversold readings: Next step involved looking at the outperforming stocks. Intraday trade is all about capturing momentum rather than reversal. It is better to avoid looking at overbought zone on RSI as a strong trending stock will result into over bought values. Also avoid capturing reversals so a stock which is already near new monthly or yearly lows should be preferred for shorting and stocks that have managed to outperform the broader markets over the period form a strong positive bar.

Channeling technique: This is one of the most important methods that I use to determine the resistance and support areas. If prices are lying near the upper end of the channel it is better to avoid going long irrespective of the momentum whereas if there is a big momentum bar formation from the channel support with a clear higher highs and higher lows and the risk reward is favorable then the stock can be shortlisted

Fibonacci projections: To apply this it is important to understand basics of Elliott wave so that the projections are done from the wave perspective. This helps in deriving the target levels.

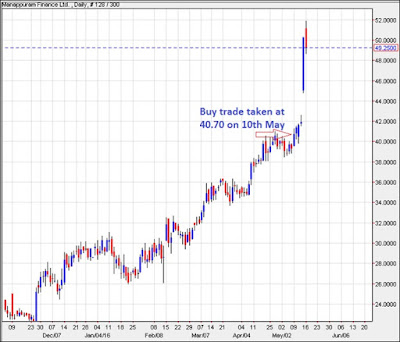
Now look at the example of one of the trades done on 10th May 2016

Manapurram daily chart:
Manapurram, Elliott wave, Stocks, Trading Strategy

Chart courtesy: netdania.com

Now the above chart is of Manappuram Finance one of the stocks on which Long positions were taken on 10th of May based on the techniques mentioned above.

The stock was up by 20% after three days i.e. on 13th May. We have exited based on the target levels but the point is to simply highlight the potential of the strategy. Also it doesn’t matter whether the movement happened on back of news or results because this stock was already in strong upside momentum even before the news break out.

Training on Trading strategy for Intraday / Positional trades using Momentum, Neo wave, Time cycles on 23rd and 24th July 2016. Learn the in depth strategy followed during the show on ET NOW. Enroll Now and avail early bird offer. Limited seats! Contact US here or write to us at helpdesk@wavesstrategy.com or on +91 22 28831358 / +91 9920422202

Intraday / Positional advisory: Subscribe for intraday / positional calls on Equity, Commodity, Currency. Subscribe for 9 months and get special discount rates under Summer Offer.

Friday, May 13, 2016

Trading rules Ashish Kyal followed to win in the ET NOW stock trading game show!

Trading rules I followed that helped me to make substantial difference and win the ET Now game show!


The notional amount of Rs. 5,00,000 was given to start the week and the rules are explained in detail post this section. Following is the thought process behind selecting the stocks, Exiting and what really made a difference.

Even though it was notional amount given but the feelings were not much different given the fact that it was viewed by millions.

1. Stock selection was done on basis of identifying the momentum stocks rather than capturing reversals. Screening out involved looking at more than 100 charts to see if there was Elliott wave pattern along with Momentum.

2. Forecasting Nifty direction and range was important to understand out of 4 calls how many to be kept on the buy side and sell side.

3. During the week from 9th May 2016 to 13th May 2016, overall tone of the market was range bound but still there was positive bias as per the Elliott wave pattern given the outperformance from Midcap and Smallcap space and so I considered having 3 Buys and one sell on most of the days. 
However, it fluctuated based on my expectation from the broader indices using Elliott wave.

4. There was option of selecting one Futures position. Selecting stock has been one of a very important task but at the same time it was crucial to leverage when majority of the indicators and Elliott wave pattern were in favor and we went long on IBReal Estate Fut on one day and short on Canara Bank Fut on another day to squeeze out most of the momentum and trend.

5. It was crucial to not lose the patience and get greedy and so we preferred trading stocks and not futures when the trend was not strong. I adopted play safe strategy when the direction of the overall market was not clear.

6. Even though individual stock follows its own direction but for intraday trades correlation with index is high and so knowing Nifty direction was very important. The most important tool at our disposal to predict that is Elliott wave, Neo wave and Time cycles.

7. Risk reward was crucial along with prudent allocation to stocks and letting profits run was important. A few of the trades helped in gaining nearly 5% in single day and targets were set bigger to allow this to happen. So the old adage of let your profits run is extremely important with prudent stops to cut out the losses.

8. Nevertheless, with all said and done a factor of lady luck also had some role to play.

And most important thing

9. Markets always teach you by playing out new things and the best way to beat it is to accept losses as they come and learn from mistakes rather than playing out with ego!

All in all it was a great week and feeling when you win by more than twice the margin compared to other competitors….Happy Trading :) !


Wednesday, May 11, 2016

Nifty trading strategy post Impact of Mauritius treaty!

What is news around Mauritius Tax treaty agreement?

Amendment to the Mauritius Double Tax Avoidance Agreement, which comes into effect April 1, 2017, will give India the right to tax capital gains from investments coming from the tax haven.

Nifty had a Gap down opening on back of the event but prices filled in the entire Gap area and came to the point where it left the previous day!

We believe that news or events results into a temporary movement and then the original trend resumes eventually.

Below chart clearly reflects the area from where Nifty reversed and the crucial levels that is important to breach for trend reversal confirmation. Trading based on news can have significant negative impact on the trading method and it is therefore important to use objective techniques like Elliott wave, Channels, Fibonacci retracement and projections to understand the maturity of trend.

Nifty 60 mins chart:
Nifty,Equity Market,News,Technical analysis

Below is the research gist published in “The Financial Waves short term update” today morning before the markets opened mentioning the key support and resistance levels one has to watch from trading perspective.
Elliott Wave analysis:

Nifty can have a Gap down opening in today’s session after India gets right to tax capital gains in amended Mauritius tax treaty. Given the event it is very important to look at the closing levels which will confirm if short to medium term direction is indeed changing.

Let us try to understand the technical structure with key levels that will confirm the reversal. Events can result into temporary spike but markets will do what it is supposed to eventually. It is therefore important to look at important support of 7730 – 7740 levels in today’s session.

The daily chart shows ….showed in actual morning research report along with detailed Elliott wave counts.

As shown in 60 mins chart, prices are testing the red channel which will act as resistance as per polarity reversal. Move below ……. followed by ……….. will break the channel support and also retrace back complete wave………. So irrespective of the event one has to keep an eye on these levels and if it gets broken then the trend towards …………..or lower levels can be expected.

Nifty has been moving within the channel range irrespective of the news! Break of important support or resistance levels will set the tone for short to medium term trend.

A positive close will change focus and news might look something like this: Tax evasion and corruption will be curbed that will help India in economic growth whereas a negative close will result into following news headline: Indian markets nervous on concerns of FIIs pulling out money given the Mauritius tax agreement treaty.

News is only the post mortem after the move has happened. Elliott wave, Time cycles and other advanced concepts of technical analysis help us to forecast the future and determine the key levels that will change the trend irrespective when the majority is caught in surprise on opposite side!

“The Financial Waves short term update” is a daily research report that shows detailed support and resistance levels along with Elliott wave counts, Time cycle concepts and other technical indicators applied on Nifty, Bank Nifty, stocks providing good trade setups opportunity. For subscription visit the Pricing page.

Tuesday, May 10, 2016

Where is Bank Nifty headed over medium to long term? The Monthly report is now published!

Post the Financial Budget published on 29th February 2016 stability returned back in Indian Equity Markets.
Nifty rose more than 16% from lows in last 2 months whereas Bank Nifty gained almost 27% during the same period. Looking at such rise now many are thinking that this is the start of next leg on upside however is it really the start or some more pain is left? To know the same we apply different kinds of advanced concept of Technical analysis which is Elliott wave, Neo Wave and Time cycles. This provides objectivity to analyze the market rather than following the crowd.

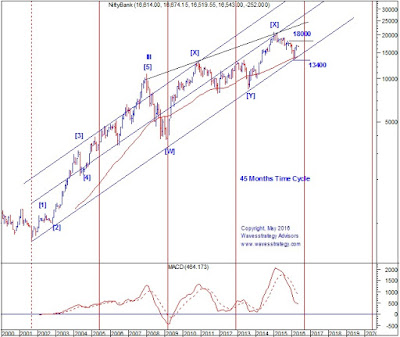
“The Financial Waves Monthly Update” is now published and part of the research on Bank Nifty is shown below:

Looking at Banking index is going to be important to understand the overall trend ongoing over past few months:

Figure 4: Bank Nifty monthly chart
Bank Nifty,Elliott wave,Neo wave,Time Cycle

Figure 5: Bank Nifty daily chart
Bank Nifty,Elliott wave,Neo wave,Time cycles

Bank Nifty which was under pressure before February 2016, managed to bounced back from 13400 level and moved higher towards 17000 level in last 2 months. The major contribution was seen from Private Banks. Recently when weakness was witnessed in broader markets, the PSU banks started to give up their gains and moved sharply lower.  This also indicates that investors are still skeptical about growth of PSU Banks. It becomes important to understand the trend of Bank Nifty which has rallied more than 3500 points over last few months.

The monthly chart indicates that the bounce back was witnessed from the channel which is connecting the lows of 2001, 2009 and 2013. It is very interesting to observe that amid all the Global events, RBI decision on rate cut, Inflation numbers, etc. prices respected the channel support and moved higher. The price action of next few months will be crucial and respecting this multi-year channel trendline is important.

During important bottoms, monthly MACD showed positive crossover. However, post the recent rally, MACD has still not moved above the signal line. This indicates that few months of sideways to negative action cannot be ruled out before we can see a meaningful bottom. This is also in sync with Elliott wave counts where we expect prices to form Triangle pattern shown on daily chart.

Time Cycle of 45 months has worked well to capture the bottom of 2001 and 2008. This cycle did not produce any significant lows in 2005 and 2013. Looking at the alternate cyclical lows there is possibility we might see a low again during later part of the year. This will also be in sync with our current wave counts. But positive confirmation will be obtained only on faster retracement of the last falling segment.

Daily chart indicates that the fall started from 2015 is forming Double correction pattern in intermediate wave [Z]. In this downfall first standard correction formed Diametric pattern and post that sharp fall followed by sharp rise indicates that Triangle Pattern is under formation in second standard correction.  As per this, prices should trade in contracting range between 18000 and 13400 level over next few months which will form the base for the upcoming rally.

Internal structure of Triangle pattern indicates that as of now wave b is ongoing and move below 15400 will indicate that wave c on downside has started which should protect the low of 13400 levels.

In nutshell, Bank Nifty structure indicates that few more months of sideways to negative action in the range of 18000 and 13400 is still pending before it forms the major low. From medium to long term perspective, move above 18000 will provide us the first confirmation that next rally on upside has started!

To know the medium to long term outlook on Nifty, Bank Nifty, one Equity stock from long term perspective, outlook on Comex Gold, Dow Jones Industrial Average and Mutual Fund selection based on Elliott wave theory ….subscribe to “The Financial Waves Monthly Update”  and for more information visit Pricing Page