Post the Financial Budget published on 29th February 2016 stability returned back in Indian Equity Markets.
Nifty rose more than 16% from lows in last 2 months whereas Bank Nifty gained almost 27% during the same period. Looking at such rise now many are thinking that this is the start of next leg on upside however is it really the start or some more pain is left? To know the same we apply different kinds of advanced concept of Technical analysis which is Elliott wave, Neo Wave and Time cycles. This provides objectivity to analyze the market rather than following the crowd.
“The Financial Waves Monthly Update” is now published and part of the research on Bank Nifty is shown below:
Looking at Banking index is going to
be important to understand the overall trend ongoing over past few months:
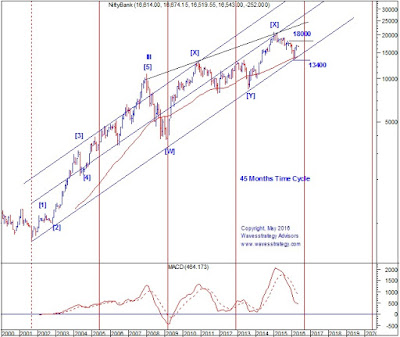
Figure 4: Bank Nifty monthly chart
Figure 5: Bank
Nifty daily chart
Bank Nifty which was under pressure before
February 2016, managed to bounced back from 13400 level and moved higher
towards 17000 level in last 2 months. The major contribution was seen from
Private Banks. Recently when weakness was witnessed in broader markets, the PSU
banks started to give up their gains and moved sharply lower. This also indicates that investors are still
skeptical about growth of PSU Banks. It becomes important to understand the
trend of Bank Nifty which has rallied more than 3500 points over last few
months.
The monthly chart indicates that the bounce
back was witnessed from the channel which is connecting the lows of 2001, 2009 and 2013. It is very interesting to observe that amid all the Global
events, RBI decision on rate cut, Inflation numbers, etc. prices respected the
channel support and moved higher. The price action of next few months will be
crucial and respecting this multi-year channel trendline is important.
During important bottoms, monthly MACD showed positive crossover. However, post the recent
rally, MACD has still not moved above the signal line. This indicates that few
months of sideways to negative action cannot be ruled out before we can see a
meaningful bottom. This is also in sync with Elliott wave counts where we expect
prices to form Triangle pattern shown on daily chart.
Time Cycle of 45 months has worked well to capture the bottom
of 2001 and 2008. This cycle did not produce any significant lows in 2005 and
2013. Looking at the alternate cyclical lows there is possibility we might see
a low again during later part of the year. This will also be in sync with our current
wave counts. But positive confirmation will be obtained only on faster
retracement of the last falling segment.
Daily chart indicates that the fall started
from 2015 is forming Double correction
pattern in intermediate wave [Z]. In this downfall first standard
correction formed Diametric pattern and post that sharp fall followed by sharp
rise indicates that Triangle Pattern is under formation in second standard
correction. As per this, prices should
trade in contracting range between 18000 and 13400 level over next few months which
will form the base for the upcoming rally.
Internal structure of Triangle pattern indicates that as of now wave b is ongoing and
move below 15400 will indicate that wave c on downside has started which should
protect the low of 13400 levels.
In nutshell, Bank Nifty structure indicates
that few more months of sideways to negative action in the range of 18000 and
13400 is still pending before it forms the major low. From medium to long term
perspective, move above 18000 will provide us the first confirmation that next
rally on upside has started!
To know the medium to long term outlook on Nifty, Bank Nifty, one Equity stock from long term perspective, outlook on Comex Gold, Dow Jones Industrial Average and Mutual Fund selection based on Elliott wave theory ….subscribe to “The Financial Waves Monthly Update” and for more information visit Pricing Page


No comments:
Post a Comment