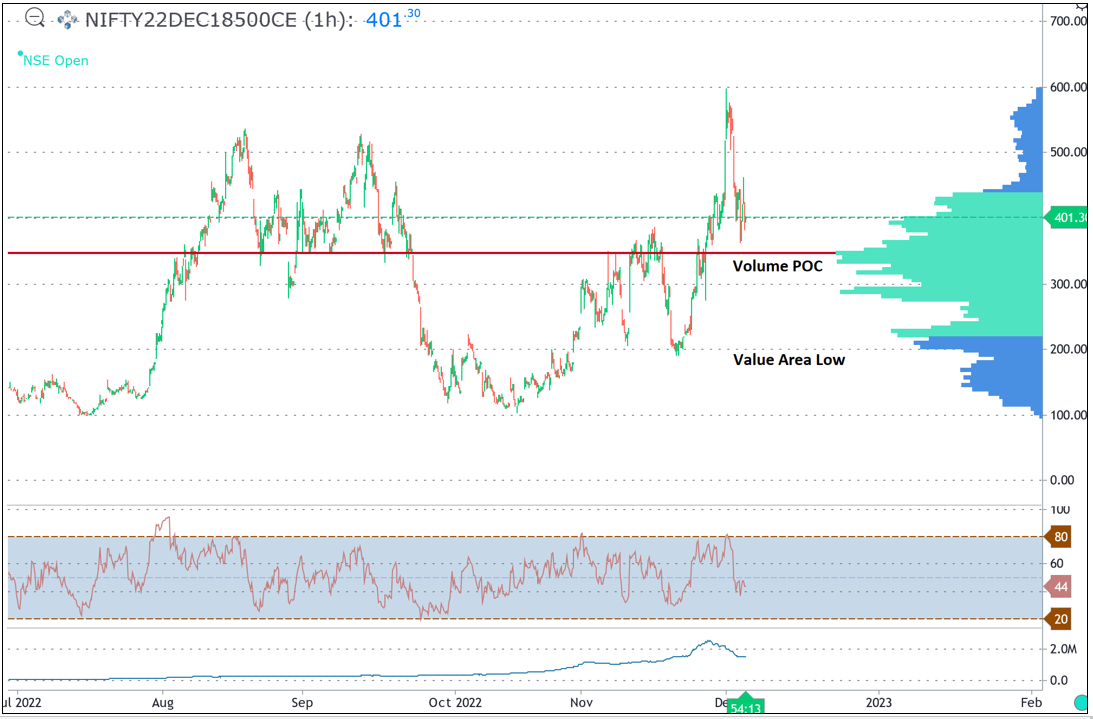
Nifty Volume profile is classic way to see where the positions are built up by big players. To trade successfully one needs to trade in direction of the bigger positions.
Below is hourly chart of Nifty 18500 call option month end expiry that shows volume activity.
Nifty 18500 Call Options 60 minutes chart

Volume Point of Control – As we can see in above options chart Volume point of Control is near 350 where major positions are build. Prices came near to this POC after breaking out on upside. This type of pullbacks are opportunity for Options Trader to re-enter into the Call Options of 18500 strike price as this level will be defended.
Price action is also important around this area. Any close above the prior candle high is also confirmation from the area of significance i.e. the big players are active to defend their positions.
In a nutshell, one can create good risk reward positions as long as 18500 call options are not trading below 300 levels which will indicate dumping of this strike options.
This is simple but powerful way of Trading using simple Volume profile applied directly on the charts.
Options Trading Using Technical Analysis (OTTA) – Learn to Trade Stocks and Options using above method of Volume profile, Open interest analysis, Pay off charts and much more in upcoming Options Trading program scheduled on 10th – 11th December 2022. Also learn to apply KST Time Indicator for the very first time on Options and Trade successfully. Limited seats only, Fill the below form for more details - https://www.wavesstrategy.com/bmwoffer


No comments:
Post a Comment