Neo wave is advanced Elliott wave method that helps to understand the overall maturity of trend. This along with Open Interest chart provides vital information for Option Traders.
Post RBI policy announcement prices showed decline on downside but is still stuck in a range.
Neo wave plot is different than that of Candlesticks. Over here we can see the internal structure of wave patterns extremely clearly.
Nifty Neo wave plot daily chart
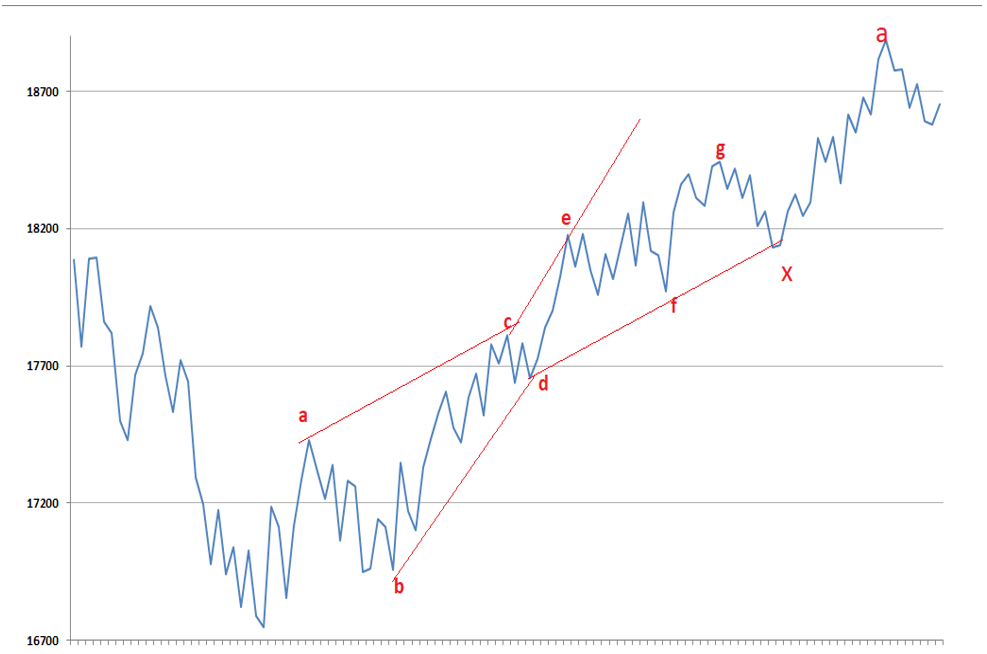
Nifty Neo wave plot 60 minutes chart

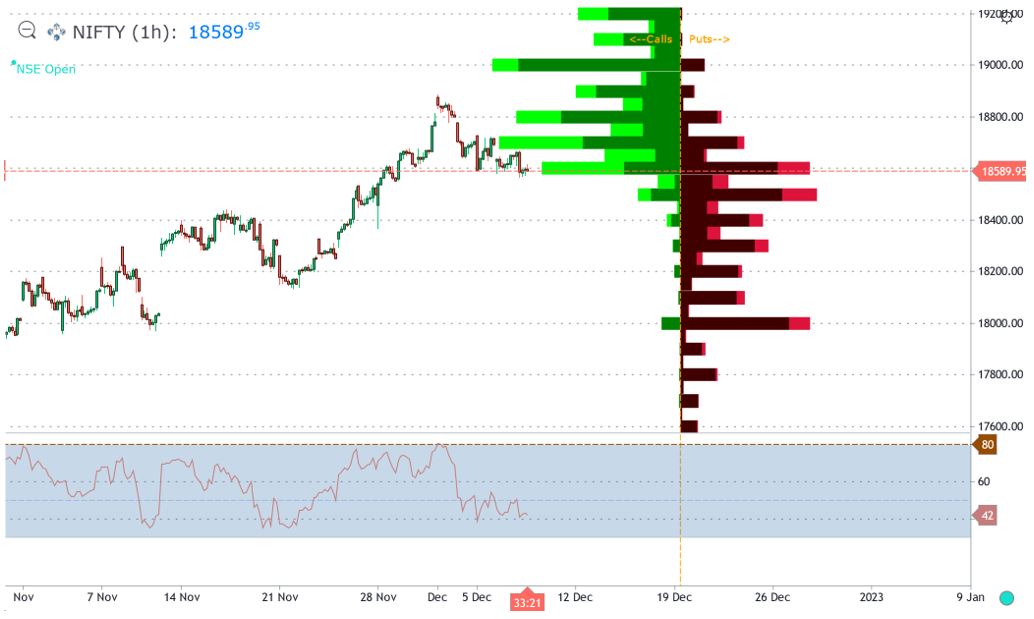
Nifty Open Interest profile
Nifty daily chart clearly shows the up move to be in form of 7 legged Diametric pattern. Earlier we were expecting it to be a Flat followed by x and then a Diametric but given the latest data this count looks best fit.
Prices post completing wave x, moved up in form of wave a and now wave b is going on. The internal structure of wave a is all corrective and so we might be either in a Triangle or Diametric pattern again. Current ongoing wave if closes below 18570 – 18560 then prices can head towards 61.8% to 76.4% retracement giving the target as 18420 levels. Failure to do that can continue the sideways action with hurdle near 18730 on upside.
Post completion of wave b, we can expect wave c to start higher again in direction of the medium term trend which is up as of now.
Open Interest analysis - Nifty 3rd chart shows sharp rise in 18600 Calls and Puts OI. It shows tug of war between Bulls and Bears for now and Option traders are creating short straddle positions expecting market to be trading in a range. Move below 18560 will result into short covering by put sellers are 18600 thereby putting pressure. On upside 18700 has major hurdle as per OI data.
In a nutshell, Neo wave and Open interest can be classic combination to trade effectively to predict the market direction and once two stage confirmation (Neo wave technique) is obtained one can get very high conviction Option buying opportunity.
Learn to Trade Options with KST and Elliott wave – 3 Days to go for Options Trading Using Technical Analysis (OTTA) scheduled on 10th and 11th December 2022, 5 Trade Setups for Option buying and selling along with Ichimoku Cloud, KST indicator, Volume and Open Interest profile, Option chain analysis, Payoff charts with Indicators like Bollinger Bands. Be a part of this Elite Traders community. For more information check here


No comments:
Post a Comment