Volume profile highlights accumulation or distribution area by big players. It is the zone where major activity has taken place during the day or week.
By understanding volume activity one can know crucial support during the day.
Nifty hourly chart – Volume profile with VWAP
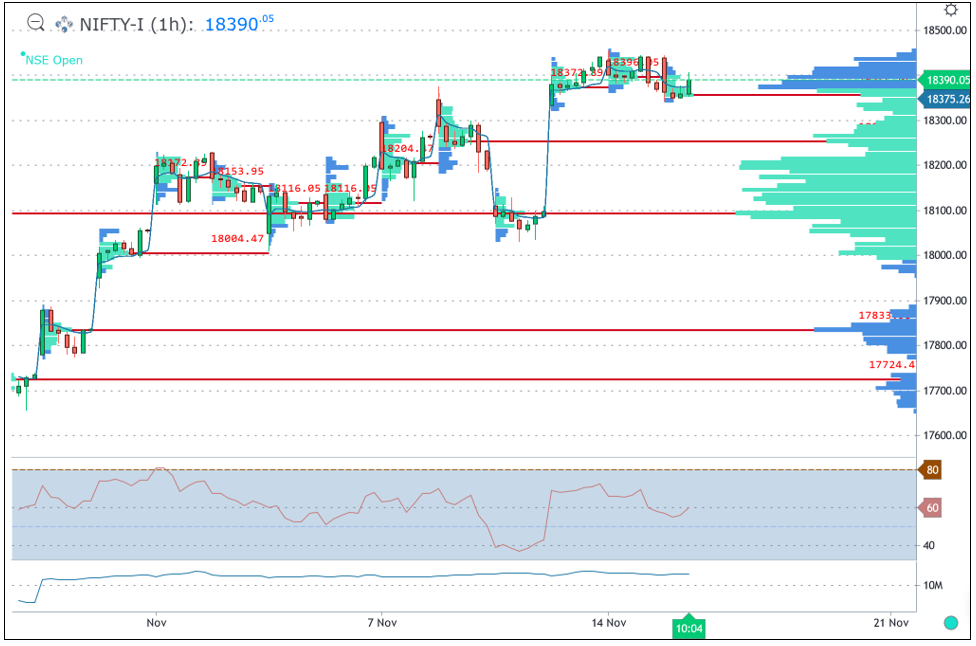
Above chart shows volume activity during the day along with cumulative volume profile across multiple time frame.
We can see that major volumes have taken place near 18375 (fut) levels which is the highest volume profile area on 15th November and also on 13th November 2022.
Cumulative volume profile shows Point of Control – are of highest volume near 18090 (fut) levels. So, big players have created their positional trades near this level.
VWAP – Volume weighted average price reflects the average where the volume has happened during the day. Prices usually find support near the VWAP and Volume POC.
These are pure insights into big player’s activity and where they are creating the positions.
In a nutshell, by looking at this simple volume technique we can make out that support as per volume profile is near 18375 (fut) followed by 18250 which is also middle of the Gap area. So market will remain buy on dips as long as 18090 is intact where big players entered the market.
Learn the science of Trading in Mentorship – Trading is a science of probability. Such simple ways of looking at the markets can enhance your trading skills along with Options breakout strategy. Be a part of elite trader’s community we call as #TimeTraders. Fill the form here for more details


No comments:
Post a Comment