Thursday, March 31, 2016

Tatasteel: Is multi-month low in place for commodity stocks?

Commodity and Energy stocks have been one of the worst performers post 2008 crisis. Tatasteel also had been a strong underperformer and few months back it came close to the low formed in 2008. But is this underperformance near completion?

A trader or investor should be open to the fact that news do not drive the prices higher of lower. But people tend to find logical news fitting the puzzle post the move has happened.

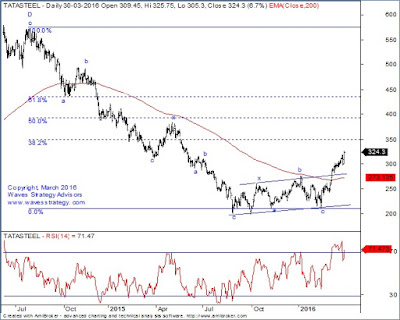
Tata Steel also showed strong recovery after flirting around 200 mark as the trend was due to reverse. Look at the below chart:

Tata Steel daily chart:

Tata Steel,Commodity Stocks,Elliott Wave, Training on advanced Elliott Wave

Wave analysis: The below research is picked up from “The Financial Waves short term update”

There was positive news for the steel sector today - India has extended safeguard import taxes on some steel products until March 2018, a government order said on Wednesday, as it looks to curb imports of cheap Chinese steel and shield domestic mills.

It seems logical to justify the up move in metal stock after the positive news. However, Metal stocks like Tata steel has been already in uptrend for many weeks even before this news came out.

The daily chart shows that prices have competed Triple standard correction pattern at the low of 210 level in the month of February 2016 and post that we are witnessing impulsive rise in this stock which is the bullish sign. It is very rare to see impulsive rise in Metal stock as few months back this sector was the most underperforming one. This increases the odd that medium term trend may be reversing on upside. We will obtain medium term positive confirmation in Tata Steel once prices move above …… level. For now as long as prices sustains above the important support of ………. level trend will be positive.

By combining Advanced Technical Analysis on Equity stocks it is possible to understand and trade in that direction with key risk reward ratio.

“The Financial Waves short term update” is a daily Equity research report published everyday morning before equity market opens that shows detailed Elliott wave counts and patterns on Nifty and stocks that can assist a trader in making trading decisions. Subscribe directly by visiting Pricing Page and selecting the product.

Tuesday, March 29, 2016

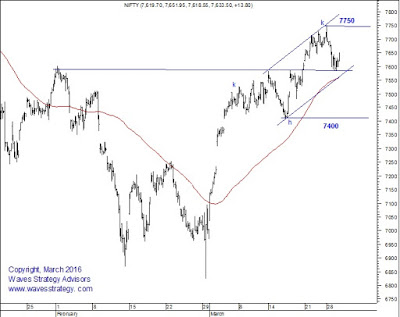
Nifty moving in “No Trading Zone”…Is it an impulse pattern or only corrective rise?

Nifty has been all over the places over past few days and a few stocks from Metal, Pharma and Realty space showed sharp decline after a strong rise. This has created an environment of confusion with lack of clarity whether the uptrend that started from 6825 is still intact or the same is over.

By using Advanced Elliott wave principleNeo wave we can apply the rules to first understand the pattern under formation. The first stage of bifurcation will be whether it is an Impulsive pattern or Corrective pattern? Now look at the below chart and try to see if in the entire up move you can count 5 waves which will suggest the ongoing pattern is impulsive in nature with all the rules being applied.

Nifty,Impulse Pattern,Elliott Wave,Neo Wave,Corrective Pattern,

Impulsive rise? Given the steepness of correction and the overlap of the down move from 7750 to 7580 this indicates that the rise is only in 3 waves and not 5 which is the minimum basic requirement of an impulse pattern. So now we cannot expect wonders to happen on the upside given this basic fact. Let us now proceed to identify which corrective pattern is under formation

Corrective pattern – Zigzag pattern has 3 waves with wave b should take more time than the preceding impulse pattern as per Neo wave principle. Now we can see this in the above chart where wave b has taken more time marked between the first two arrows. To get a confirmation that the pattern under consideration is over we require faster retracement below the last rising segment as per the 2 stage confirmation technique. Looking at the above chart we can see that so far the fall has not fully retraced the rise in form of wave c from 7400 and so the fall can be either wave x or some other pattern is forming. This now raise the odds that wave c is either not complete and forming Ending diagonal pattern or the entire pattern is developing into Extracting Triangle. 

Confused? This is exactly what markets are doing as there is no confirmation. The recent fall has opened up number of possible scenarios and it is only on faster move above 7750 or below 7400, clear trend confirmation will be obtained. At times one has to wait for clear directional signals rather than jumping at every move. This is one such time!

Our clients have been able to capture the most of the trend and it is now time to relish what is made rather than giving back everything during times of confusion when the pattern under formation is not clear. You can now see the pattern under formation on daily basis in our flagship product “The Financial Waves Short term update”. To subscribe visit the Pricing page.

Wednesday, March 23, 2016

Nifty: Moving Average difference indicator to identify change in BIGGER TREND!

How to use Moving Average difference indicator to identify that the existing trend has reversed?

Below article focused on application of indicators and what does it indicate from medium to long term perspective -

Nifty had another positive close yesterday after a small correction on intraday basis. Majority of stocks continued to move higher and a few stocks like DLF, TataSteel, SBI looks like giving a strong positive break after brief consolidation. As mentioned in earlier updates one should avoid catching a top in current market and surprises will be on upside.


Nifty daily chart:

NIFTY, TECHNICAL ANALYSIS, ELLIOTT WAVE, MOVING AVERAGE


Following explains why this time the uptrend is different than that seen previously during the fall of 2015. As shown in first daily chart, the momentum so far is strong and rise of such magnitude without any meaningful retracement was not seen during the entire period of down trend that started in March 2015.

Difference of Moving average:The difference of Moving average indicator shown below the price chart has managed to decisively cross above the resistance blue line thereby indicating that the momentum is much stronger this time compared to the previous rise. Also there is still room on upside as the extreme reading seen just before the downtrend started was 270 and the difference of average currently is at 168.

Volumes:Volumes have continued to stay above normal during the entire period of 2016 and Nifty is now at the level seen in December 2015. This above average volume indicates buying interest and accumulation which increases the odds that there can be a positive breakout …………

From wave perspective we are still keeping the possibility open that the current up leg is either wave ……. or wave ………..


“The Financial Waves short term update”is our flagship product that covers detailed technical analysis along with charts and explanation using Elliott wave, Time cycles, combination of indicators. We have been accurate in capturing a top near 9119 in 2015 and now the bottom near 7000 made in February 2016 end. Staying against the crowd when it is most required is possible only by using the objective techniques that we keep publishing in the daily research report. For subscription options visit Pricing Page.


Monday, March 21, 2016

Nifty surged by more than 12% in current month! What to expect next?

The month of March 2016 has been going good for Indian Equity Markets. Post budget i.e from 1st March 2016 Nifty started to rally and touched 7660 level in quick time. We are able to capture the sharp up move from 7100. Part of the research that was published in “The Financial Waves Short Term Update” is shown below:
March 01, 2016 Time: 10 am

Interim Update: Nifty has shown a very big Gap up opening and follow up rally after many weeks. This has resulted into faster retracement of last falling segment and can mark completion to atleast the short term downtrend. Surprises can be on upside provided the level of 6980 is now protected. Any long positions should use this as very important stop as break below it will continue sideways to negative action. Markets are moving higher despite the extreme pessimism and negative news. Also displaced 54 days cycle low has been due today. All in all the rally should extend beyond 3 days and take out 7255 which will be a very important confirmation for trend reversal. Position yourself accordingly when the majority will be caught in surprise.

Nifty 60 mins chart: Anticipated in the morning of 1st March 2016Nifty, Elliott Wave, Neo Wave

Nifty 60 mins chart: Happened till now
Nifty,Neo Wave,Elliott Wave

We are constantly mentioning in our research for the highest probability as per Elliott wave theory for the next trend in Nifty.

Part of research from March 18, 2016 is shown below -

From wave perspective, it is unclear for now the terminal point or the end point of minor wave …. as there are new highs in the congestion area and no faster retracement. Few days of price action is required to confirm the pattern under formation. Also if the up move is indeed impulsive then we should not see retracement below 7200 which is the power area of the rise….

So, where Nifty is heading now? Subscribe to “The Financial Waves Short Term Update” which covers Nifty and 3 stocks with in-depth research. For subscription visit Pricing Page

Friday, March 18, 2016

Tech picks L&T, HDFC Bank, HPCL, Ashok Leyland by Ashish kyal on CNBC TV18 18/03/16


Directly from the studio of CNBC TV18. Tech picks L&T, HDFC Bank, HPCL, Ashok Leyland, etc

For subscription to daily Equity research using Elliott wave counts and stock tips visit www.wavesstrategy.com

Wednesday, March 16, 2016

Nifty Neo wave plot discussion

Neo wave charts are plotted differently then the normal Line, Bar or Candle chart. Following chart of Nifty shows the Neo wave plot on daily scale...It becomes very easy to identify the termination points and analyze the pattern after plotting the chart as per Neo wave method.

The speed of rise after the low at 6825 clearly indicates that the pattern post wave X is complete as the last leg of the same is taken out in faster time thereby providing both
Price and Time confirmation - Neely 2 stage confirmation.
Can you identify the Neo Wave pattern after wave X?
Nifty Neo Wave plot

The above chart shows Diametric pattern which is a 7 legged correction as per Neo wave. The completion of this pattern is confirmed on faster retracement back above D-F trendline and complete retracement of wave G. 

The entire up move post wave G can be either wave a or wave i which is the start of new trend. Strong momentum above 7600 will be bullish whereas move back below 7400 will result into deeper retracement of the up move.

To participate in our ongoing discussions or start your own discussion visit-

Tuesday, March 15, 2016

Nifty continues to consolidate after a spectacular rise...What is next?

Bottom Line: Nifty has failed to generate positive momentum after Gap up opening. Close above 7600 level is essential now to continue the up move.

Nifty daily chart:


Nifty 60 mins chart:


Wave analysis:

In last session, Nifty had Gap up opening at 7540 level and moved higher towards 7583, however post that prices were unable to garner the upside momentum and closed near 7540 levels.

Over past few days we witnessed that after breaking above the previous high Nifty is reversing back on downside thereby keeping the overall trend in a range. Prices have tried to fill the Gap area in last session which is not very promising signal, however just one day of action is not a good idea to judge the overall trend and price action from current levels will be crucial to see.

As shown in daily chart, Nifty formed a DOJI pattern in the previous session. The psychology behind the pattern suggests that there can be halt in the up move and closing above the high of this candle becomes important for resumption of up move.

Short term topping cycle of 49 days is due today and it is therefore important to stay alert in case there are exhaustion signs. Strong momentum above 7600 will indicate delay in the topping cycle but break below previous weekly low near 7424 will result into the downside retracement and turn the short term trend negative.

As shown in 60 mins chart, prices have continued to move in non trending environment from last 6 days. The red channel resistance is close to the previous high and crossing above this trendline is crucial. Failure to do that over next 2 days will be a warning sign. For now let us keep a close eye on important support levels. Existing longs can continue to trail stop towards 7420 level.

In short, Nifty is moving in consolidation. Close above 7600 is required to continue the up move however any break of 7420 followed by 7350 can start retracement of the recent rally.

Strategy for the day: For today, long positions can be created if Nifty moves above 7580 with 7520 as stop and target of 7640. Short positions can be created below 7460 levels with day high as stop and target of 7420.

                Note: Levels mentioned in this report is as per Cash (Spot) market

The above simply shows one small portion of the entire research of “The Financial Waves Short Term Update” Get access now to this short to medium term forecasts research report and see yourself detailed Elliott / Neo wave counts applied along with Time cycles on Nifty, Bank Nifty and stocks. 

For subscription visit the -  PricingPage


Wednesday, March 9, 2016

Nifty forecasting using Volumes and its rate of change, Shift in market dynamics!

February 2016 had been a month of events and news with market moving in extreme pessimistic environment. PSU Banks were one of the worst performing sectors until 29th February i.e. the Budget day. Results declared by most of these banks were indeed very poor with stark rise in NPAs. The stock prices reacted sharply and started discounting the worst ahead. It was only later when the trend was due to reverse we saw sharp reversal on upside.

Budget day continued to act as a reversal day during a downtrend and this time it was no different. One of the most important concept that continued to suggest that the downtrend was in matured stages were Channels.

Pessimism was ruling not only among the retailers but institutional investors as well as brokerage houses as well. It seems majority of them sold off their positions just before the B-day at throw away prices in expectations that much lower levels are on cards and in anticipation that Nifty is heading towards 6500 sub levels. In fact Nifty movement towards 6825 was a perfect trap on 29th February and post that we have seen a recovery of more than 650 points now in just 4 days of time. This simply shows the risk of staying on the wrong side of the market and the risk associated with it.


Figure 1: Nifty weekly chart:

Volumes: As shown in Figure 1 we have seen significant rise in volume in month of February. Such sharp rise in volumes is not very often. The black Moving average line on Volumes clearly indicates change in the underlying dynamics and the same was observed only during low of August 2013  and lows of 2009. To further validate this assumption we have used Volume Rate of Change (Volume ROC) indicator that measures the speed with which volumes have increased. Such sharp rise in indicator and extreme level is not very often. It was only in 2008 and 2012 that we saw Volume ROC touching such extreme levels. Also in 2012 it was near the top rather than after sustained selling. So the only period when we saw volume ROC moving towards such extremity was during the low of 2008 – 2009. This further confirms that the dynamics of the market is changing and the downtrend that started from the March 2015 is probably complete. Also the methods that work well before might no longer be valid and we should not be surprised to see a break above the downward sloping channel encompassing the entire correction.

Confirmation from USDINR: (shown in actual research report – The Financial waves Monthly update)

Time cycle……

Nifty Neo wave analysis…….The Diametric pattern as shown in Figure 3

The above simply shows one small portion of the entire research of “The Financial Waves Monthly update” Get access now to this medium to long term forecasts research report and see yourself detailed Elliott / Neo wave counts applied along with Time cycles on Nifty, Bank Nifty, USDINR, DJIA, Stocks, Mutual Funds and much more… For subscription visit the PricingPage.

Most Advanced training on Time cycles and Advanced Elliott wave – Neo wave to identify trade setups, Portfolio creation and stock selection: Neo wave analysis when combined with Time can give very high conviction trade setups. Also understand forecasting future is about probability and not certainty but all of the advanced concepts suggest same thing it is prudent to take the opposite stand to crowd. We are one such scenario and markets have kicked off with a BANG so far! Predicting such moves is not possible if Time cycles are ignored…

Elliott Wave, Neo Wave and Time Cycles are one of the most advanced concepts of technical analysis. Ashish Kyal, CMT will be conducting the course in Mumbai on 12-13 March, 2016.

Limited seats left Register Now! For more details-Call or whats app on- +91 9920422202Email ID- helpdesk@wavesstrategy.com


Thursday, March 3, 2016

Nifty – Power of Hurst’s Time Cycle and combining it with Neo wave! A whopping 650 points up in 4 days!!!

Nifty has rallied by a whole 650 points in less than 4 days. Prices touched intraday low near 6825 on 29th February on the Budget day and showed sharp recovery and trading near 7480 as of now. Still the trend has no signs of exhaustion.

Such tremendous rally might be surprise to many but it was on 1st March when Nifty crossed 7100 we published a strong bullish outlook to subscribers of “The Financial Waves short term update” that the trend is strongly positive and it is prudent to be against the crowd this time when majority have been bearish.

Such bold stand just at the right moment is that too against the crowd is possible only because of the following research that used the concept of Time cycle and Neo wave – Advanced Elliott wave.

Time cycles are one of the most dynamic components in technical analysis. It is a challenging concept and is not easy to predict. It is therefore necessary to combine cycle analysis along with a few other techniques to get high conviction trade setups.

Hurst’s Time cycle developed by J. M. Hurst, an aeronautical engineer, believed that the cycles that are applicable in field of physics across the universe should have its application in the field of stock market as well. He believed that there are standard cycles present in the nature and we need to identify the actual cycle in close representation with these standard cycles. 

The below chart of Nifty shows the application of Neo wave which is the advanced concept of Elliott wave. Simply imagine if the pattern seems to be near completion and is also confirmed by Time it results into sharp increase into the probability of success. There are few instances when the cycles can be off and so price confirmation is always crucial. However, the power is when the cycle is synchronized with pattern and when it works, which happened NOW, you can see the power of trend.

Nifty has rallied from the lows of 6825 made on 29th February to the high of 7480 as of now and counting.

Nifty daily chart:

Neo wave and Hurst’s Time cycle: The low made on the Budget day coincided exactly with the 54 days time cycle as per Hurst’s method and also marked an end to wave (g) of intermediate wave g that too with strong positive divergence on RSI and reversal from channel.

It was the application of all of the above techniques that made us take a bold positive stand when everyone was expecting a serious capitulation. Such movement is rare to happen and it is only after many years we have seen such a huge move in a short span of less than 4 days. This can indeed be start of a very big uptrend….

Forecasting market and at times to the point is a thrilling experience when market behaves exactly as expected irrespective of what the crowd is saying…Trust me! You can now learn these methods and start building up the experience of Trading using Time cycles and Neo wave with practical application on charts. Attend the most Advanced training on Technical analysis – Application of Neo wave with Time cycles with ideal trade setups and portfolio creation. Training is scheduled on 12th and 13th March 2016 in Mumbai. Limited seats left! Register now for training and get the monthly research report with long term forecasts FREE along with it…There cannot be a better investment than this…To block your seat contact / WhatsApp us on- 9920422202.

Subscribe NOW to know what is next from here and do not miss out on such opportunities that arise once in years. For Elliott wave research and Time cycles subscribe to “The Financial Waves short term update”. For Neo wave research get access to “The MF waves update”. Visit PricingPage for subscription options.

Tuesday, March 1, 2016

Nifty: An alignment of indicators - strong rally yet again from Channel, RSI positive divergence, Time Cycles!

Following is a part of research picked up from “The Financial waves short term update” – a daily research report containing detailed Elliott wave counts, Time cycles and other advanced technical tools applied on Nifty and stocks.

As expected high volatility was witnessed in last session due to budget. In the morning, Nifty moved higher towards 7068 level however post that prices sharply reversed on downside and formed new low at 6825 level. After that V shaped recovery was witnessed towards 7095 level and finally prices settled at 6987 level losing 42 points. From highs to low on intraday basis movement of more than 250 points was witnessed which is in lines with the movement seen during previous Budgetary sessions. Also prices closed forming a small body and a big shadow again a normal tendency as highlighted in earlier report.

Few important pointers on which there was sharp reaction during the session:- Increase in Option STT – Nifty reacted negatively, Excise duty raised from 10% to 15 per cent on tobacco products other than beedis resulting into sharp swings on ITC, nevertheless the stock managed to close positive surprising everyone, VDS for declaring undisclosed income to be taxed as 45% post which we started seeing positive reaction. All said and done Nifty did what it has done before during previous budgetary session – a swing between high to low of more than 200 points but closing near the level where it opened.

Nifty daily chart:

Today morning at 10 am itself when Nifty crossed the high of 7100 we immediately published the following interim update:
Time: 10 am, Nifty spot: 7135

Interim Update: Nifty has shown a very big Gap up opening and follow up rally after many weeks. This has resulted into faster retracement of last falling segment and can mark completion to atleast the short term downtrend. Surprises can be on upside provided the level of 6980 is now protected. Any long positions should use this as very important stop as break below it will continue sideways to negative action. Markets are moving higher despite the extreme pessimism and negative news. Also displaced 54 days cycle low has been due today. All in all the rally should extend beyond 3 days and take out ………… which will be a very important confirmation for trend reversal. Position yourself accordingly when the majority will be caught in surprise!


It is rare to see synchronized alignment of majority of indicators both from Price and Time perspective. Indian Equity markets have rallied despite of all the prevailing pessimism. This week has marked an important low and we are keeping a close watch on the internal Wave structure to confirm to reconfirm a very BIG trending move surprising the majority!

You cannot afford to miss such opportunity when each of the techniques are pointing in the same direction which happens probably once in a year. To know what is next from here subscribe now to “The Financial Waves short term update” by visiting Pricing Page.

Most Advanced training on Time cycles and Advanced Elliott wave – Neo wave to identify trade setups, Portfolio creation and stock selection: Neo wave analysis when combined with Time can give very high conviction trade setups. Also understand forecasting future is about probability and not certainty but all of the advanced concepts suggest same thing it is prudent to take the opposite stand to crowd. We are one such scenario and markets have kicked off with a BANG so far! Predicting such moves is not possible if Time cycles are ignored…

Elliott Wave, Neo Wave and Time Cycles are one of the most advanced concepts of technical analysis. Ashish Kyal, CMT will be conducting the course in Mumbai on 12-13 March, 2016.

Limited seats left Register Now! For more details-
Call or whats app on- +91 9920422202
Email ID- helpdesk@wavesstrategy.com