Nifty Using Bollinger Bands, Elliott Wave Pattern
Nifty moved as expected today, was it predictable using a simple technical analysis study and advanced Elliott - Neo wave.
Check out this example of how we used Bollinger bands with wave counts to identify price movement. Below chart shows Nifty Neo wave count along with Bollinger Bands. This research is picked up from the daily Equity research report.“The Financial Waves short term update" which was published today before market opens
Nifty Daily Chart

Nifty 60 mins chart
In the previous session, Nifty opened with a huge gap up of 130 points. During the day, Index continued to show a good rally. At the end of the day, Nifty closed at 17359 with a gain of 1.63%.
Amongst the stocks, Reliance Industries closed with a gain of 4.31%. Along with this, Nestle, Infosys, ICICI Bank, Tata Motors, TCS were also the top gainers for the day. On the other hand, Apollo Hospital, Sunpharama, Adaniports, Asian Paints were the top losers list by the NSE.
All the sectors witnessed good buying. Wherein, IT, Auto, FMCG, Energy, Realty sector gained the most and closed on a positive note with a good gain of 2.45%, 1.01%, 1.06%, 1.97%, 1.63% respectively. Broader Indices showed good buying for the second consecutive day and closed on a positive note. India VIX closed with a huge loss of -5.14% at 12.93
On the weekly chart, we can see that prices have exactly bounced back from important support of 16800. Also, this week’s candle has closed above previous candle’s high which indicated pause in a downtrend.
In the previous session, Nifty witnessed a good rally and as a result formed a big bullish candle. We have also used Bollinger Bands. Wherein, prices have close above mid bands and looks ready for a move towards the upper bands. However, follow up action is required to confirm the same. On the daily chart, wave b is still ongoing on the downside so post this rise we might start seeing a downward correction as our 55 Days cycle is due on 18th April.
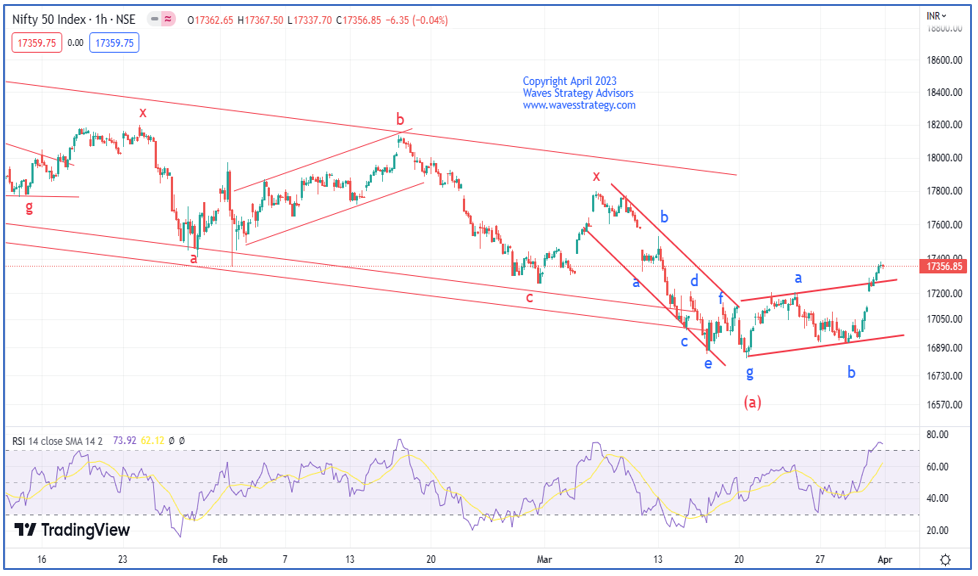
On the hourly chart, we can clearly see breakout of the classic double bottom formation which happened in the Friday’s session. After a breakout Nifty witnessed a good rally. We have predicted few days back about fib retracement of 61.8% of entire wave (a) which comes to 17420. So now, we can expect a pause near this level. Currently we are in wave c of (b) which opens possibility of a flat pattern.
In a nutshell, short term view for Nifty looks positive. For now, use buy on dips method to ride the trend with the targets of 17420 or higher as long as 17180 remains intact on the downside. Any move below which will be a first sight of concern.
Happened:
Nifty has been moving precisely as per Neo wave count. Nifty followed buy on dips method as we mentioned and achieved our Target of 17420 and made high of 17428.05
Options Trading with Elliott wave, Neo wave and Time cycles – Learn to trade Stocks & Options along with Open Interest profile, Volume profile, KST Time indicator, 5 clear Trade setups for Options buying in Options Masterclass scheduled on 15th and 16th April, combine this to other level of forecasting with Master of Waves (MOW) on 6th – 7th May 2023. Both this combined courses is called Become Market Wizard (BMW). Act now and learn to generate passive source of Income, Limited seats only - Know More.


No comments:
Post a Comment