Nifty 55 Days’ Time Cycle with Neo wave – Is BIG Trend Starting UP?
Time cycle and Advanced Elliott wave – Neo wave acts as GPS of market and helps us to understand the overall maturity of trend.
On Nifty we are showing 55 days Time cycle zone that has helped to capture most of the lows and Elliott wave counts. Both Time and Prices are absolutely in sync!
Nifty daily chart:
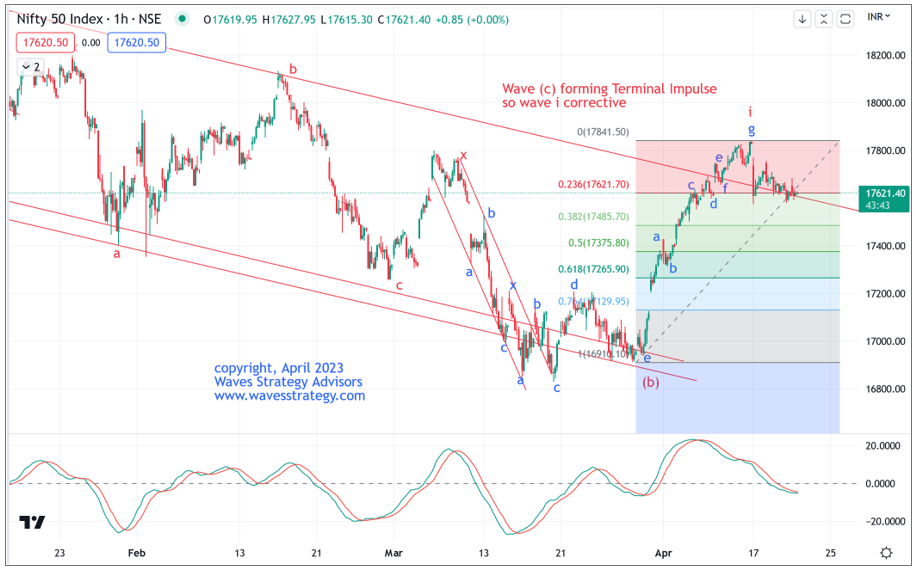
Nifty hourly chart:
We have been bullish on Nifty as soon as 17060 levels were broken on upside and prices rallied by nearly 800 points from there.
Given the sharp rise and break above the channel there is possibility that wave (b) got completed at the lows and we are now in wave (c) of a Flat correction. As per Neo wave rules, in a Flat correction wave (b) should take more time than that of wave (a) and should also retrace more than 61.8% of wave (a).
The rise from the lows as shown on hourly chart is in form of corrective pattern and so wave (c) might be forming Terminal impulse pattern. Wave i looks to be complete and wave ii is under formation which has retraced 23.6% of wave i so far. Break below 17570 will open targets for 17485 which is 38.2% Fibonacci. Move above 17800 will start wave iii on upside.
In a nutshell, Nifty might have started bigger upside trend with the fall only a part of wave ii and post its completion wave iii might start higher. Upside targets can be derived once wave ii low is in place.
Major difference between Elliott wave and Neo wave is that – Neo wave has more stringent rules and patterns that helps trader to stay objective giving classic trade setup with prudent risk reward right from smallest time frame to long term forecast.
Master of Waves (MOW) – Learn the science of Trading with an Edge of Waves and Hurst’s Time cycles in an exclusive Live online training scheduled on 6th – 7th May 2023. Get Bonus videos of 6 hours on Elliott wave basics before the live event, Limited seats only, Early Bird Ends on 25th April 2023. Act now and forecast markets like never before.


No comments:
Post a Comment