Bank Nifty is following Advanced Elliott wave – Neo wave pattern amazingly well and when this is combined with Bollinger Bands, Channels and Candlestick it is possible to forecast with high accuracy.
Elliott wave becomes very useful during major reversals and gives us high conviction trade setups. See the below research which clearly highlights this fact.
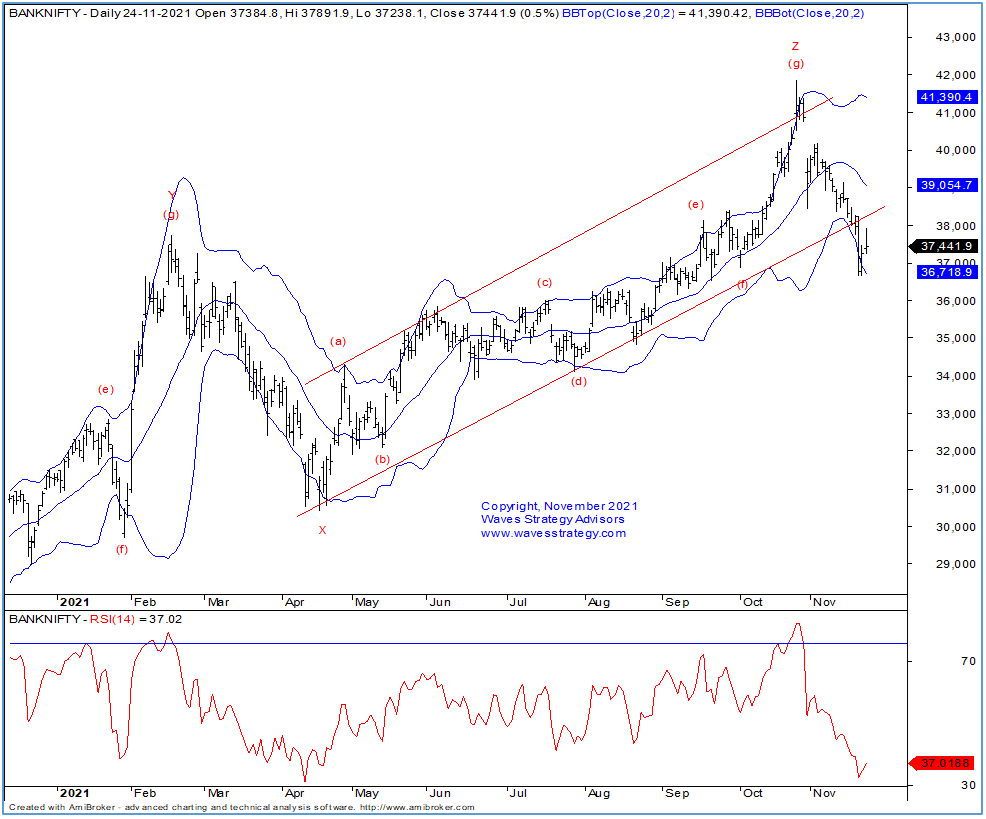
Bank Nifty daily chart:
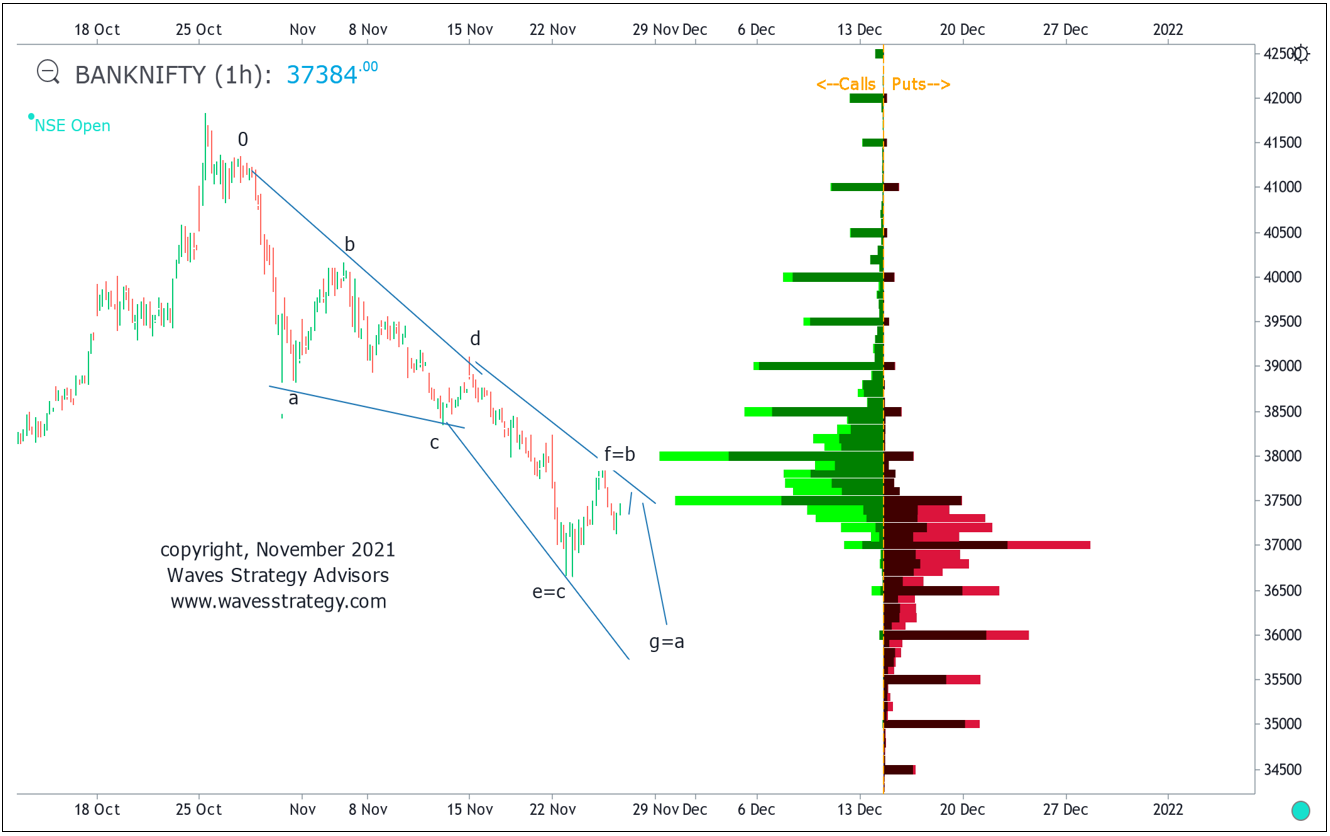
Bank Nifty hourly chart with Open Interest Profile
Elliott wave analysis:
On the daily chart, we can see that after completing minor wave g near 41800 level sharp fall has been witnessed which suggests that intermediate wave Z might have completed. Prices have made an attempt to bounce from the support of lower Bollinger band however till we do not see close above middle bands, we can expect weakness to persist. Looking at the break of upward rising channel support, there is high likely that trend can remain in sell on rise mode.
Bank Nifty Hourly chart Diametric pattern with Open Interest profile – Bank Nifty has been forming precise Diametric pattern which is a 7 legged correction. This pattern is described in Neo wave with all legs corrective in nature. Forecasting can be done as per following relationship between each of the legs as follows:
Wave g = wave a
Wave f = wave b
Wave e = wave c
The above is a guideline and helps a trader to trade accordingly. We are combining Open Interest profile as well along with it for high conviction trade setups
Open interest profile: suggests that there is highest call open interest at 38000 levels and highest change in Call OI is at 37500 and so crossing this zone can be challenging, whereas on the downside 37000 has highest Put OI and also the change. It seems that for bears to take back control we have to see decisive break below 37000 levels and for the up move break above 38k is must. Now that we have these crucial OI data and Elliott wave pattern it seems that there can be a minor pullback but not necessary post which Bank Nifty can start moving lower again towards 36400 – 36000 levels which is target as per Diametric pattern and also minor OI support.
In a nutshell, above research clearly shows that by knowing about Elliott wave, Neo wave patterns and combining OI data one can form excellent trading strategy either in Options or Futures. Many are focussing only on Options without knowing the market outlook which will not yield into any profitable outcome. It is therefore important for traders to focus on understanding these simple and easy techniques and then form Option strategies.
Most Advanced Training on Technical Analysis - Learn to Trade Options with step by step trade setups along with breakout strategy, Option Buying strategy, Volume and Open Interest profiling for Intraday, Swing trading, Also options can help to generate passive income if one understands the risk and accordingly take profitable positions. Become Market Wizard – BMW will combine Option Trading Using Technical Analysis (OTTA) on 11th – 12th December and Master of Waves (MOW) on 15th – 16th January. Trust me this will change you trade options and forecast the markets. Early Bird Ends on 30th November, know more here


No comments:
Post a Comment