It is possible to capture explosive moves in stocks using price patterns and advanced techniques like Time cycles.
Today morning we published TCIEXPRESS in "The Financial Waves Short Term Update" which our subscribers receive pre-market every day. Check out below the detailed research report that we published.
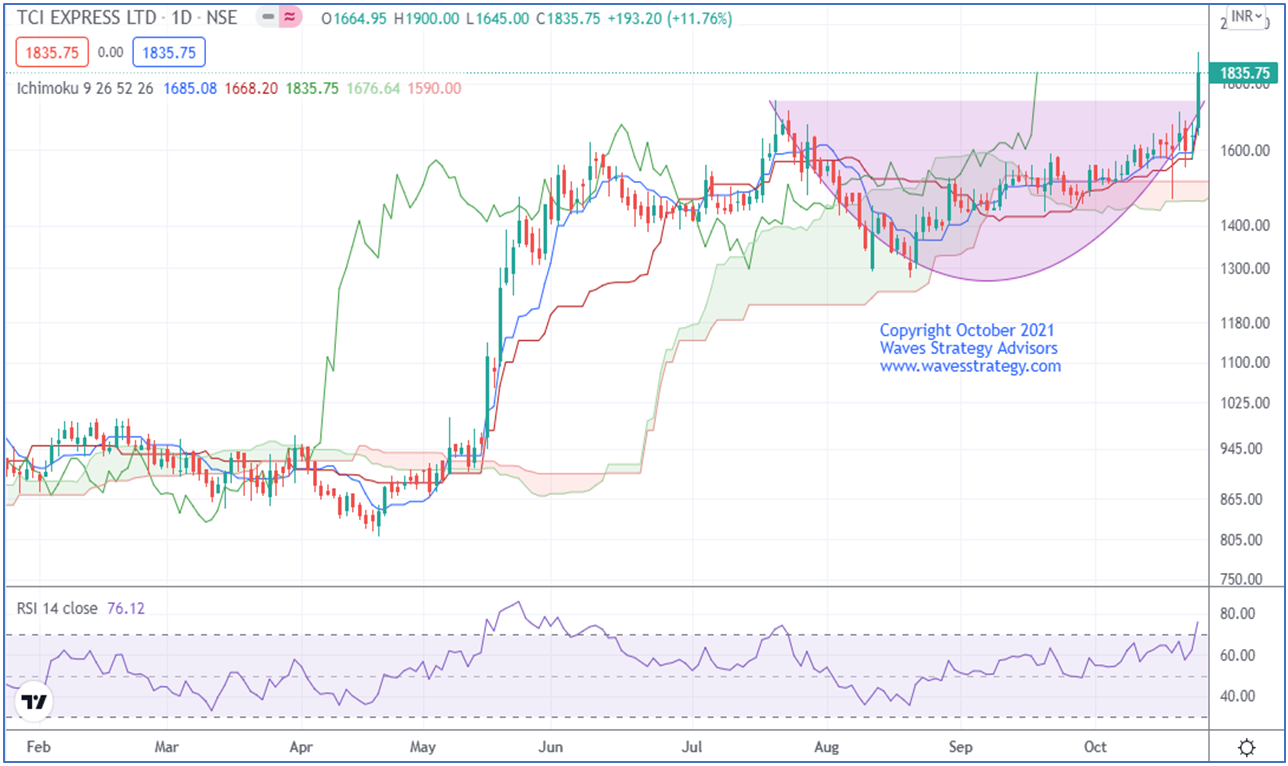
TCI Express Daily Chart as on 26th October 2021 (Anticipated)

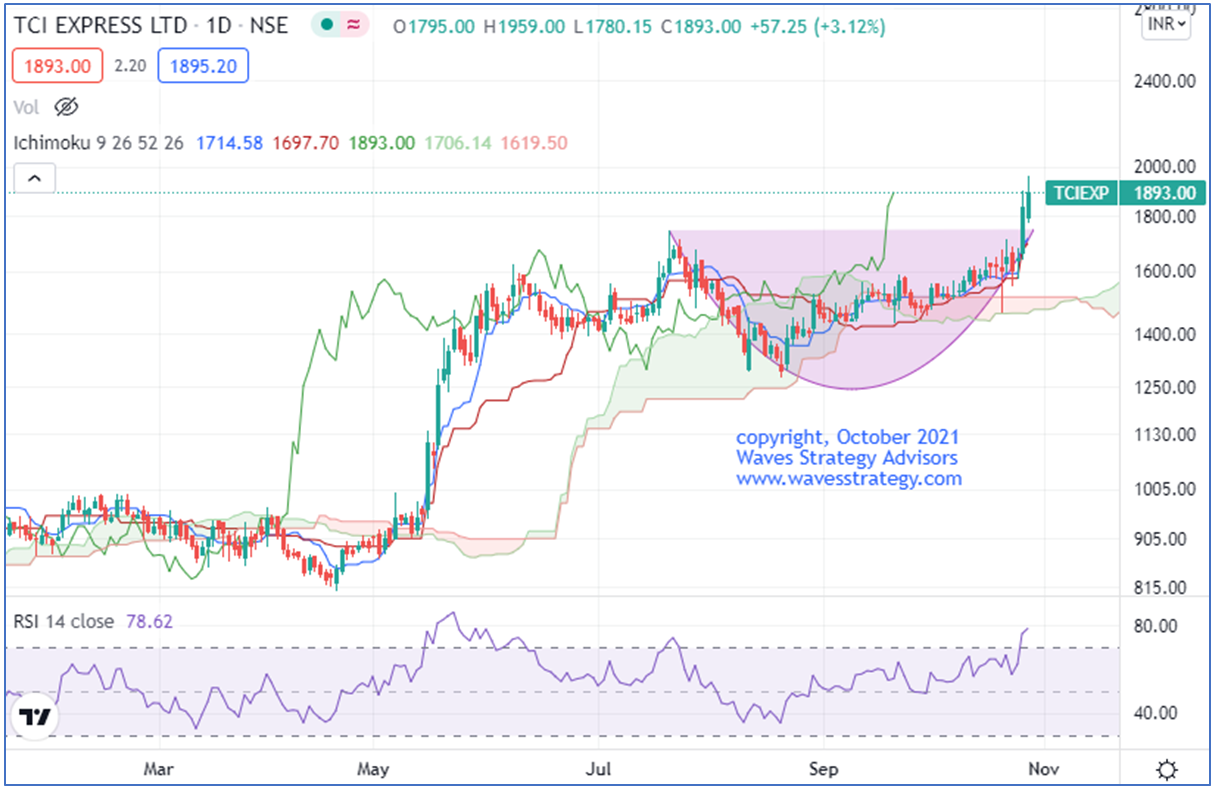
TCI Express Daily chart as on 27th October 2021 (Happened)

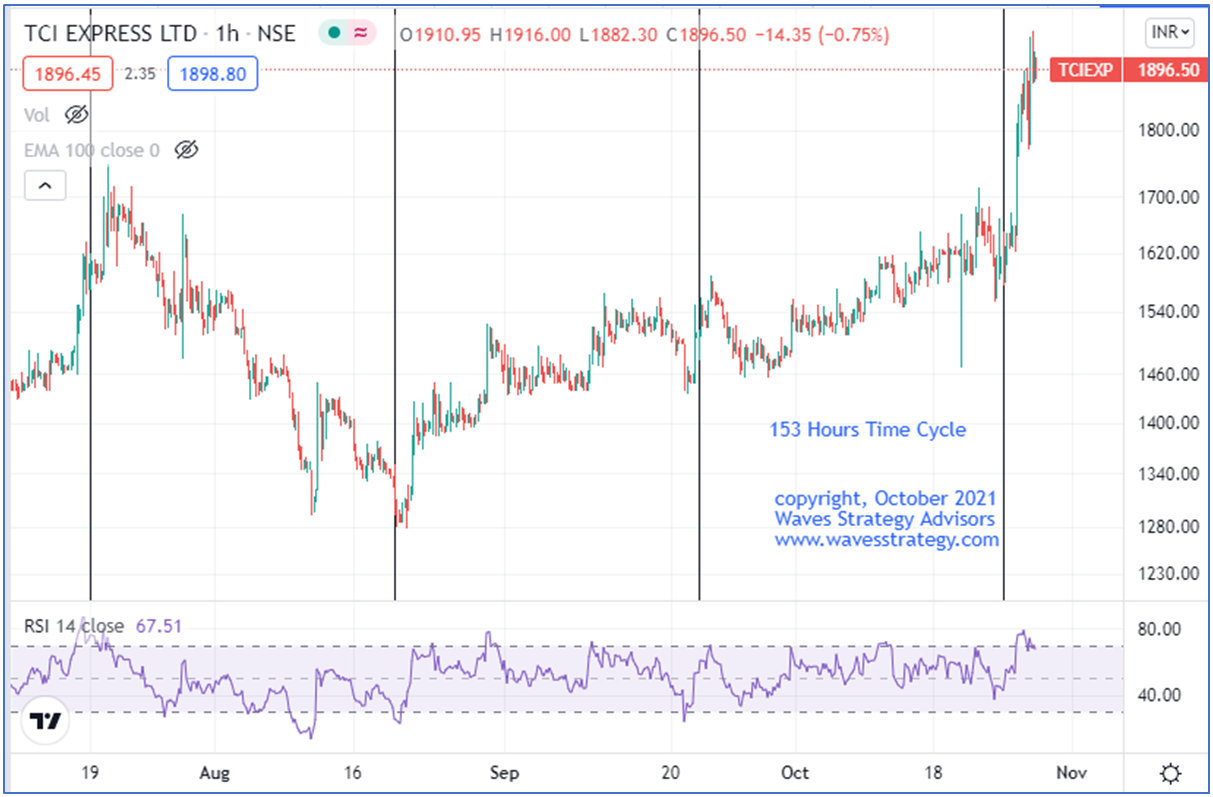
TCI Express Hourly Chart

Waves analysis-
On the daily chart, in the previous session, the stock formed a bullish candle. We can see rounding bottom pattern has formed. Prices have given close above 281 level which confirms breakout from the pattern. Price is trading above the Ichimoku cloud which indicates that the short term bias is bullish.
On the hourly chart, the vertical lines represent 153 hour time cycle. As we can see that as prices approach this cycle an important low is formed. This helps us to time the market correctly. After the recent cycle of low formation, this is a perfect opportunity to buy.
In short, the trend for this stock is positive. Use dips towards 1760-1750 as buying opportunity for a move towards 1970-2000 levels as long as 1680 holds on the downside.
Happened-
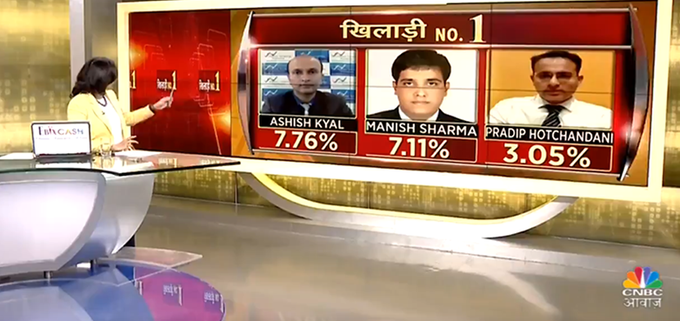
After we published the report the stock made a high near 1959 levels! We also gave a buy call on TCIEXPRESS on CNBC AWAAZ KHILADI NO 1 game show at 1785 and it hit 9% target at 1950 within a day!

Even in such elevated markets, want to know which stocks to pick up which gives better returns over the period of one year, this DIWALI. Get 4 stocks which are sector based outperformer. Subscribe to our this year Diwali Picks
Mentorship on Timing the Markets for the FIRST TIME EVER starts November 2021 – In this Mentorship program, all the necessary tools are given right from stock selection methods, strategy, follow-up action to derive a complete trade setup in step by step fashion. Contact us on +919920422202


No comments:
Post a Comment