Nifty has moved precisely as we expected and showed in previous research on 20th October 2021 – Nifty 3 Powerful Indicators
Now let us look at the same chart again and see what is expected from here on using Advanced Elliott Wave technique – Neo wave with Open Interest analysis
Nifty hourly chart:
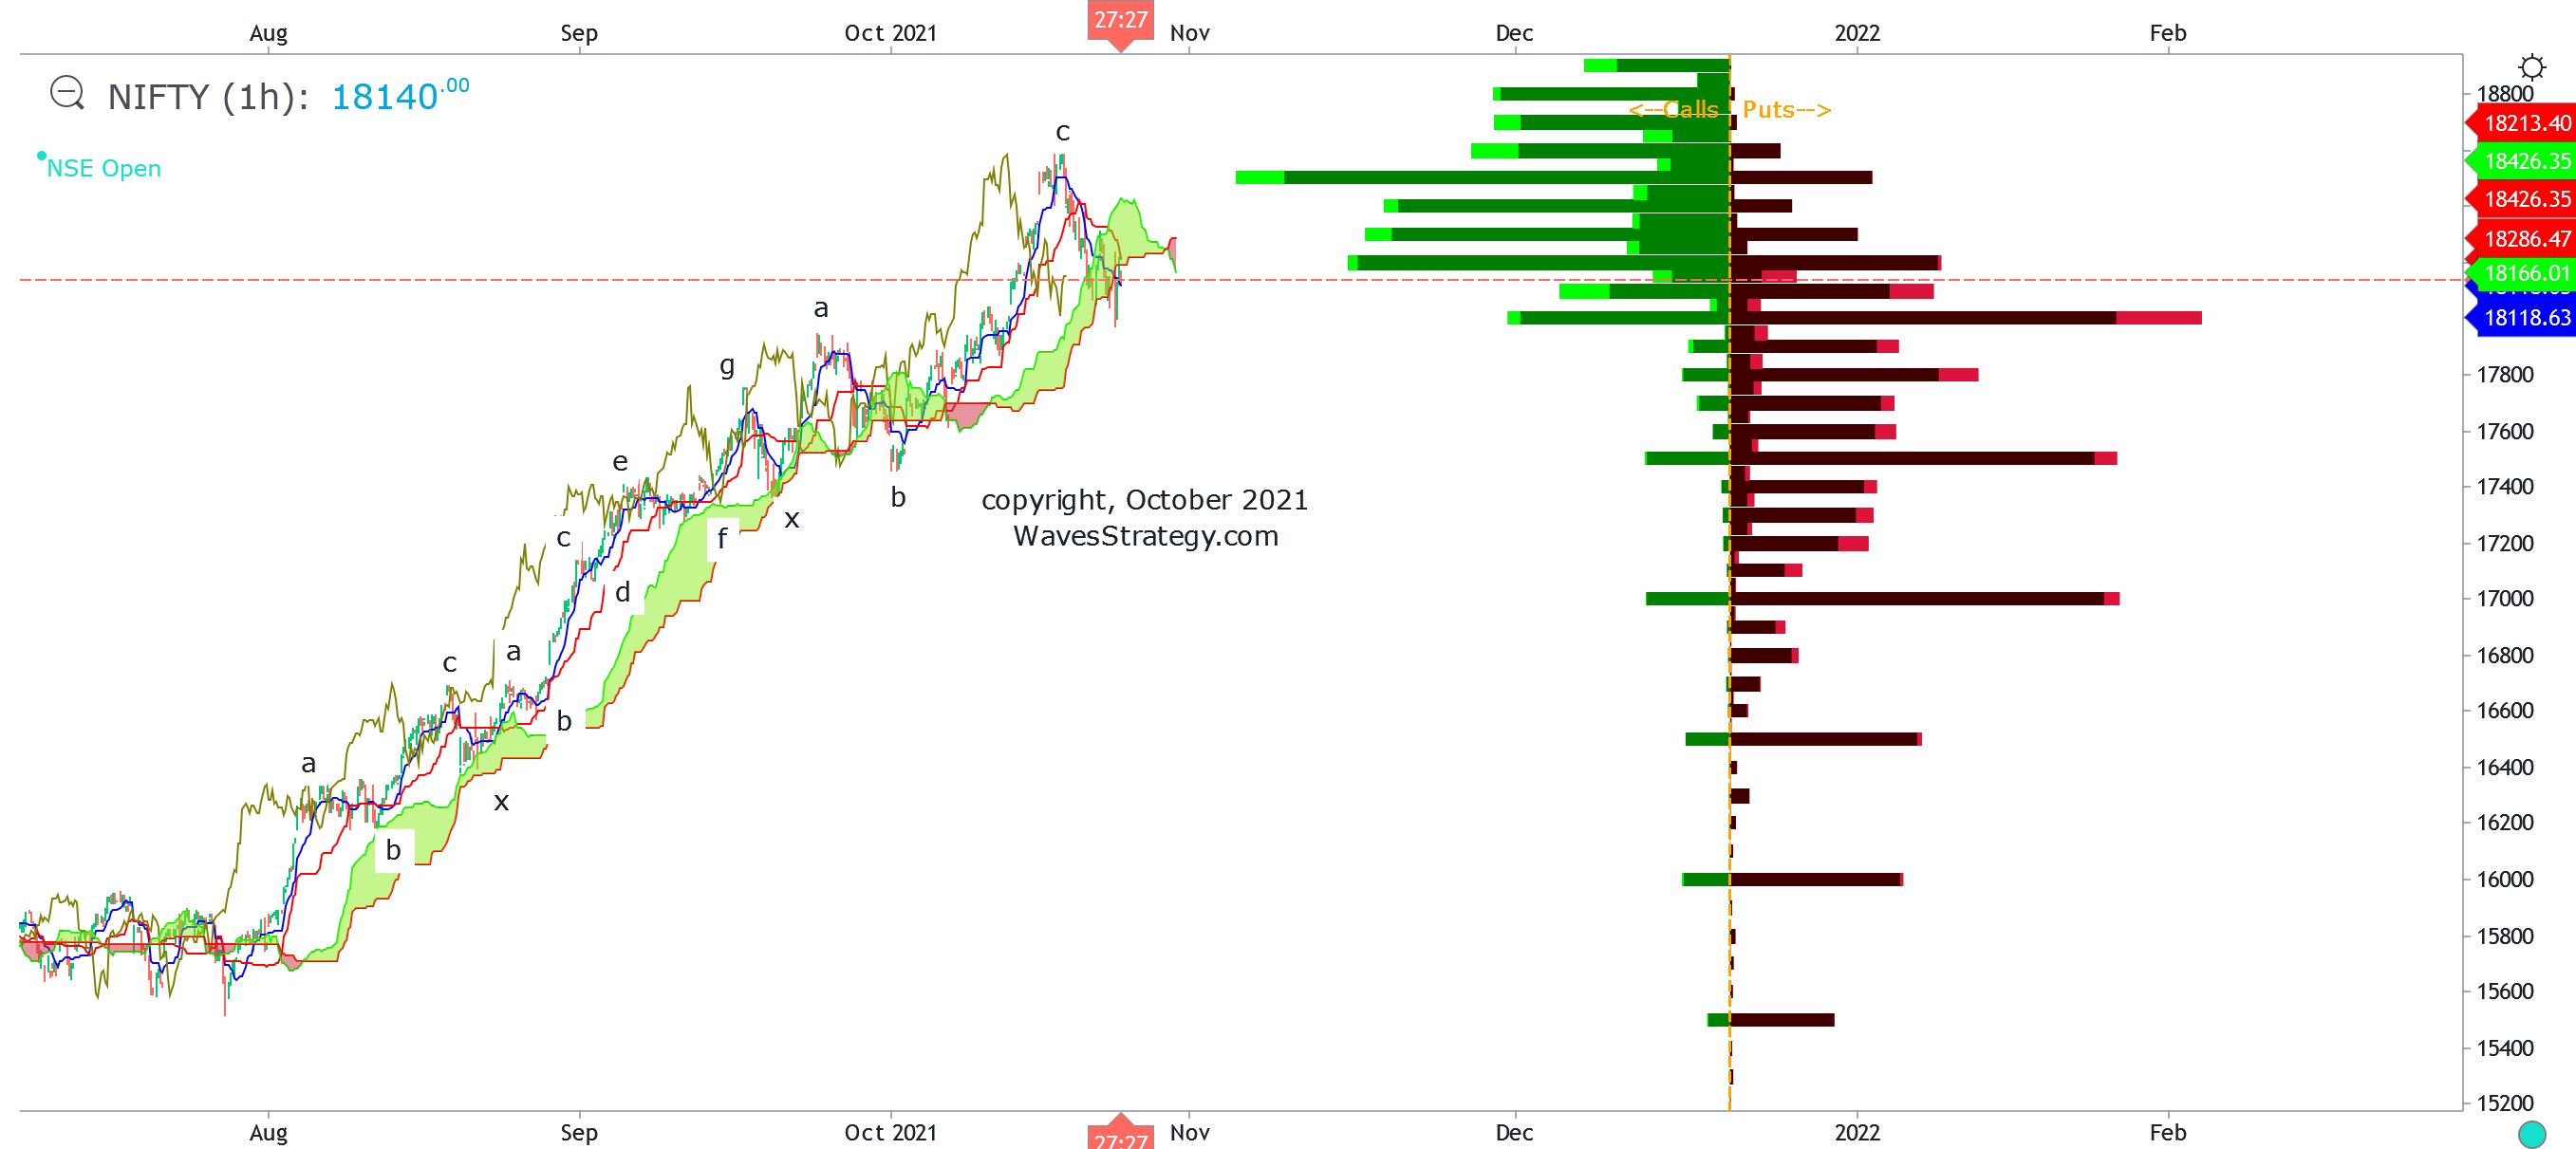
We can see that prices are moving lower in the form of wave d and this pattern can either form a Diametric or a Neutral Triangle. Diametric is a 7 legged corrective pattern and Neutral triangle looks like a Head & Shoulder. We are currently moving in form of wave d and a bounce back above 18300 is required to confirm that wave d is over and wave e is starting higher.
Ichimoku Cloud - As of now we can see that prices are just moving near the lower end of the Ichimoku Cloud and we now need a break below 17970 for negative price confirmation. This will turn the overall setup into sell on rise and indicate a Neutral Triangle pattern is probably under formation. Combination of Ichimoku cloud along helps trader not only as a signalling method but also for deriving trades.
Open Interest Profile – Nifty OI profile continues to indicate that 18k is very important level with highest Put OI build there. A break below 17950 – 17930 zone will suggest that the puts will not get nervous and start covering their short positions thereby accelerating the selling pressure once 17950 breaks.
During this time Bank Nifty has continued to rally sharply on upside with stocks like ICICI Bank, Axis Bank moving up and on other hand stocks like IRCTC, IEX which have been traders favourite on long side are crashing. This will result into traders getting stuck and simply guessing what is going on. It is a typical scenario of a Triangle pattern formation and few days of consolidation can be expected. This is how one can understand Wave personality.
Thus the above 3 different techniques continued to suggest that markets are at crucial juncture and we need to either see a break below 17950 for a bigger downside correction or a move above 18300 for some positivity. Selling options is going to be ideal during such scenario to make money from ongoing volatile movement.
3 Months of Mentorship on Timing the Markets – Early Bird Ends on 25th October 2021, Time the market using Simple, Easy and Effective Time cycle trading techniques with combination of Step by step methods using Candlesticks, Timing tools and Elliott waves, complete handholding, stock selection methods, Algo creation, Option trading with a complete Trade plan, to know more contact us on +919920422202