Monday, July 26, 2021

Nifty Volume Profile Analysis on Hourly Charts

Volume Profile is a simple and very interesting technical analysis method that can help to understand the activity behind the scenes in terms of institutional traders.

This is simple but powerful method that can enhance the accuracy of trading giving all together a different insight and conviction for taking a trade.

There are different shapes to Volume profile named “D Shaped”, “P Shaped”, “b Shaped”

Volume Profile:
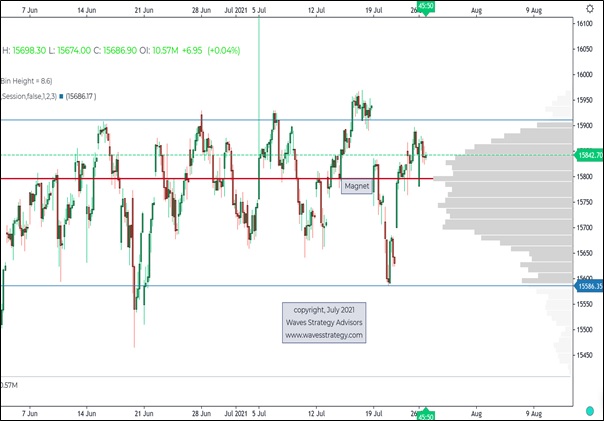
We can see a D shaped profile above. The Magnet line which we have talked about in many webinars has continued to work amazingly well and prices are continuing to cling to it despite of events or global market movement.

The lows and highs made is very near tot eh highlighted grey area high and lows of the profile. This also adds to the fact that these are important support and resistance and we need to break away from the Magnetic pull by breaking the levels above 15920 or below 15620 for a clear trend to emerge.

Basis of this simple concept of volume profile one can make out zone of strong support and resistance where the volume profile is highest and if price acceptance above that zone hints towards bullish sign. However, one can further combine this along with Ichimoku cloud and other intraday techniques to enhance the conviction for trading.

In short, Volume profile is a powerful tool that can be adopted by traders to get a peek into what are big players or institutional traders are upto and then ride the trend in that direction. We are yet to see a clear breakout or breakdown here and once that happen a strong trend will emerge. Keep tracking volume profile but do not forget to combine it with Open Interest Analysis, Patterns and Elliott Wave for a complete trading system.

WSA Special Offer 2021 – Subscribe to the daily research “The Financial Waves short term update” and get access to such advanced concepts of Technical analysis with Elliott wave charts. Get access under the special offer and get 30% lower price for combining different research products. Get access here

Learn the Science of Trading and see how simple methods like Volume Profile with Open interest analysis can be combined to form effective trading strategy in this Season 2.2 of Become Market Wizard (BMW). Season 2.2 will be different than earlier and will cover topics which are simple but powerful required for profitable trade setups. No prior knowledge required. Early Bird Ends soon and only Limited Seats available. It is time to become a profitable trader. Early Bird Ends in 4 Days. Know more here or Contact / Whatsapp +919920422202

Friday, July 23, 2021

Nifty Intraday Trade Strategy using Ichimoku Cloud! by Ashish Kyal, CMT


Nifty is back within the range but how can one trade on Intraday basis using Ichimoku Cloud, Bollinger Bands check in this video. Ensure to see through till the end where specific strategy for Monday is also discussed.

Wish you all a very Happy Guru Pournima and may this day brings awareness and blissfulness to you and everyone around you

Simple powerful Training on Candlesticks, Bollinger Bands, Elliott Wave, Time Cycles. Learn from Ashish Kyal, CMT, Author of an International Book. For more details check- https://www.wavesstrategy.com/bmw
-------------------------------------------------------------------------------------------------------------- Testimonial from Client – “Ashish is an extremely well read and informed teacher, and it was a pleasure to learn practical trading from him. I will recommend his courses to anyone who is a beginner or expert in trading. For the beginner it will be eye opening!.”– By Aditya Shroff -------------------------------------------------------------------------------------------------------------- We would love to connect with you on Social Media: Twitter - https://twitter.com/kyalashish/ Instagram - https://www.instagram.com/kyalashish/ Facebook - https://www.facebook.com/AKTradingGurukul Telegram - https://t.me/AKTradingGurukul LinkedIn - https://www.linkedin.com/in/ashishkyal/ -------------------------------------------------------------------------------------------------------------- "SEBI “Research Analyst” No: INH000001097 Visit us : https://www.wavesstrategy.com/ Write to us on : helpdesk@wavesstrategy.com Contact us: +91 9920422202 -------------------------------------------------------------------------------------------------------------

Thursday, July 22, 2021

Stock Picks For Today on CNBC Awaaz 22nd July 2021


#Stocks for the day for Khiladi No.1 - SAIL, Sagar Cements & Alkyl Amines. see how to trade them using objective methods. 

Simple powerful Training on Candlesticks, Bollinger Bands, Elliott Wave, Time Cycles. Learn from Ashish Kyal, CMT, Author of an International Book. For more details check- https://www.wavesstrategy.com/bmw
-------------------------------------------------------------------------------------------------------------- Testimonial from Client – “Ashish is an extremely well read and informed teacher, and it was a pleasure to learn practical trading from him. I will recommend his courses to anyone who is a beginner or expert in trading. For the beginner it will be eye opening!.”– By Aditya Shroff -------------------------------------------------------------------------------------------------------------- We would love to connect with you on Social Media: Twitter - https://twitter.com/kyalashish/ Instagram - https://www.instagram.com/kyalashish/ Facebook - https://www.facebook.com/AKTradingGurukul Telegram - https://t.me/AKTradingGurukul LinkedIn - https://www.linkedin.com/in/ashishkyal/ -------------------------------------------------------------------------------------------------------------- "SEBI “Research Analyst” No: INH000001097 Visit us : https://www.wavesstrategy.com/ Write to us on : helpdesk@wavesstrategy.com Contact us: +91 9920422202 --------------------------------------------------------------------------------------------------------------

Wednesday, July 21, 2021

Why Nifty Can Crash if 15500 Breaks! by Ashish Kyal, CMT, Author


Nifty is at cusp and in this video I have given enough reasons why we stand right on the edge. You can see Nifty Neo wave two stage confirmation, Bollinger Bands, Intermarket analysis - DJIA, FTSE, and a lot more.

Simple powerful Training on Candlesticks, Bollinger Bands, Elliott Wave, Time Cycles. Learn from Ashish Kyal, CMT, Author of an International Book. For more details check- https://www.wavesstrategy.com/bmw
-------------------------------------------------------------------------------------------------------------- Testimonial from Client – “Ashish is an extremely well read and informed teacher, and it was a pleasure to learn practical trading from him. I will recommend his courses to anyone who is a beginner or expert in trading. For the beginner it will be eye opening!.”– By Aditya Shroff -------------------------------------------------------------------------------------------------------------- We would love to connect with you on Social Media: Twitter - https://twitter.com/kyalashish/ Instagram - https://www.instagram.com/kyalashish/ Facebook - https://www.facebook.com/AKTradingGurukul Telegram - https://t.me/AKTradingGurukul LinkedIn - https://www.linkedin.com/in/ashishkyal/ -------------------------------------------------------------------------------------------------------------- "SEBI “Research Analyst” No: INH000001097 Visit us : https://www.wavesstrategy.com/ Write to us on : helpdesk@wavesstrategy.com Contact us: +91 9920422202 --------------------------------------------------------------------------------------------------------------

Thursday, July 15, 2021

Nifty 18 Days Time Cycle with CandleStick Breakout Strategy

Option Traders have been writing both Call and Put options assuming a tight range bound movement on Nifty over past many days.

In our latest webinar on 11th July 2021, we clearly showed 18 Days Time Cycle and mentioned a positive breakout to happen when Nifty was only at 15680 levels. From there prices have already climbed by more than 250 points. So, we anticipated a positive breakout when majority were busy trading the range.

Below video clip explains why we turned bullish using this simple method of Time Cycles with CandleSticks, see it yourself to believe it:

Nifty 18 Days Cycle Explained:

Happened: Nifty moved from 15680 to 15940 levels already now. It is amazing to see how brilliantly these techniques work and this is how institutions and big funds keep a tab of time. We want to ensure that this simple method of timing the market is available to everyone who wants to trade using scientific approach and prudent risk management strategies. Nifty has moved by more than 250 points from there and participants of that webinar are already deep in the money if they acted based on charts and methods and not on basis of any news.

Do understand for me to give out something this valuable requires a few months of time so that you can derive the Time by yourself. In the upcoming Mentorship program starting on 17th July 2021 we are going to give you the necessary tools required to be a successful trader in every way with a complete Trade plan, Risk & Money management strategy, Handholding, Option Strategy and much more. 2 Days to go: ACT NOW, Simply Contact +919920422202