Nifty Trading Using 5 Minutes Time Cycle!
Time cycle is simple way to identify price support areas. Time support zone with price action gives lethal combination for traders with high accuracy.
We have been applying Time cycles right from Weekly, Daily,
15 Minutes and 5 minutes chart. Depending on the Trading Time frame these cycle
can accordingly be used.
Below is chart of Nifty showing Time cycles on 5 minutes
chart.
Nifty 5 minutes chart:
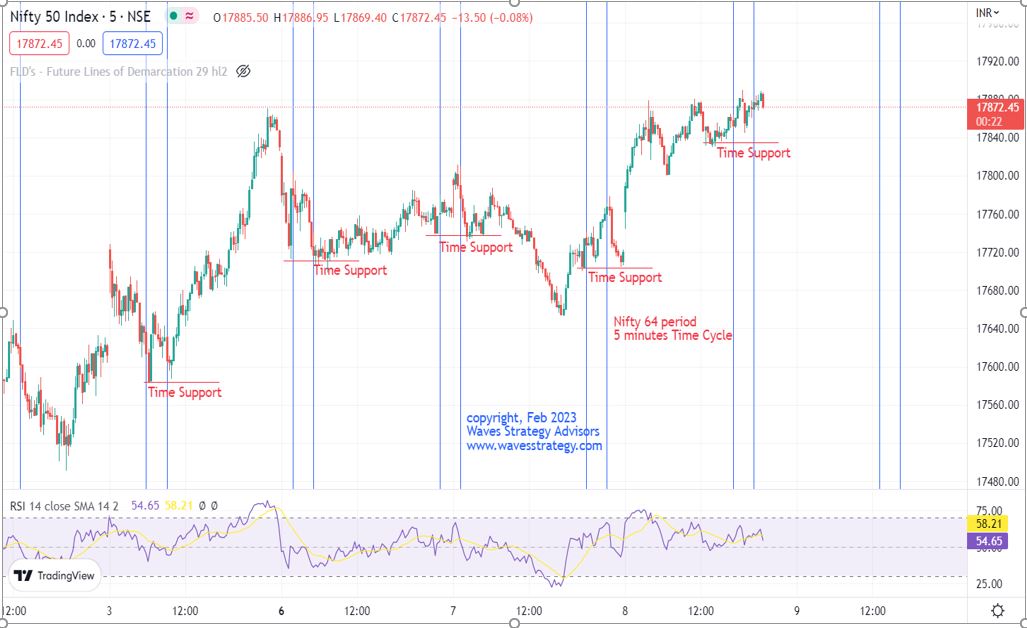
Time cycles are used to catch lows. Above chart shows 64
period Time cycle applied on 5 minutes chart which has been working
exceptionally well.
As shown, the vertical blue lines are Time cycle zone and we
have marked price area that is support as per this time cycle. Every time
prices approach near the zone of Time cycle there is upward thrust that can be
seen. So one can use Time as a very important parameter for taking the trade on
buy side.
If the Time support area breaks there are also sell signals
as per this method which happened on 7th February.
To derive the targets one can use the concept of FLD
(Hurst’s Time cycle) that can help traders with targets as well.
In a nutshell,
Hurst’s Time cycle is a complete trading system by itself if implemented
correctly and provides trader with both Price and Time forecasting ability. For
Option traders Timing is the most important parameter but largely ignored which
can make all the difference in Trading PNL.
Master of Cycles – Learn
the science of trading Hurst’s Time
cycle as a complete system along with price targets, stoploss and entry levels.
Combine this with Gann square of 9 and Ichimoku cloud for deriving high
accuracy trade setups. Be a part of this Elite trading community #TimeTraders
and start life transformation journey.


No comments:
Post a Comment