We had applied ADX indicator on TAINWALCHM and were able to capture a 19% move in a single day. You can also use these to identify stocks with momentum for short-term trades.
While trading the market it is important to understand the behaviour of the market. Using price action along with we can predict price moves in stock with high accuracy. Check out how we recently identified one such breakout in TAINWALCHM.
We published TAINWALCHM analysis in "The Financial Waves Short Term Update" on 6th January 2023 which our subscribers receive pre-market every day. Check out below the detailed research report that we published.
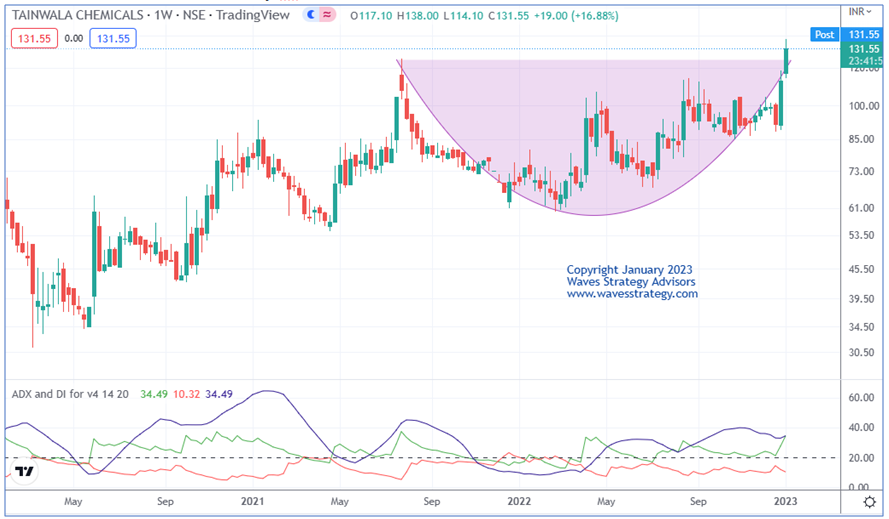
TAINWALCHM Weekly chart as on 6th January 2023: (Anticipated)
TAINWALCHM Weekly chart as on 9th January 2023: (Happened)

Wave analysis as on 6th January 2023
TAINWALCHM has been moving higher recently and intact in strong uptrend. In the previous session it closed with a massive gain of 12.97%.
On the weekly chart, in the previous session prices formed a bullish candle. A weekly close above 125.50 will confirm breakout of the rounding bottom pattern. We have shown ADX indicator which gives an indication if the stock is trending or in a trading range. The low readings of ADX indicates that the stock is in a range. The adx of this stock is 34.49 giving an indication of a trending market. The reading above 25 means strong directional strength
As shown on the hourly chart, price is trading above the ichimoku cloud which indicate that the short-term bias is bullish. Closest support is placed at 124.
In short, trend for this stock is positive. Use dips towards 127-129 as a buying opportunity for a move towards 140-142 levels as long as 124 holds on the downside.
Happened
The stock moved as we expected and have given breakout of rounding bottom with huge volume followed this stock has gained more than 19% from the dip levels and achieved our target and moved above it.
Join the Exclusive premium Telegram community for research reports and Advisory Calls on Nifty, Bank Nifty, stocks, Commodity, and Currency along with charts, an explanation of Elliott wave counts upto 30% OFF. Access now here
3 Month of Mentorship - Learn the science of Timing the market over more than 3 months with lifelong association, live trading sessions, Algo creation and everything focusing on Time trading from stock market expert Ashish Kyal, CMT, Author. Register here


No comments:
Post a Comment