Gann square of 9 is simple yet powerful way to understand price action areas for targets and stoploss.
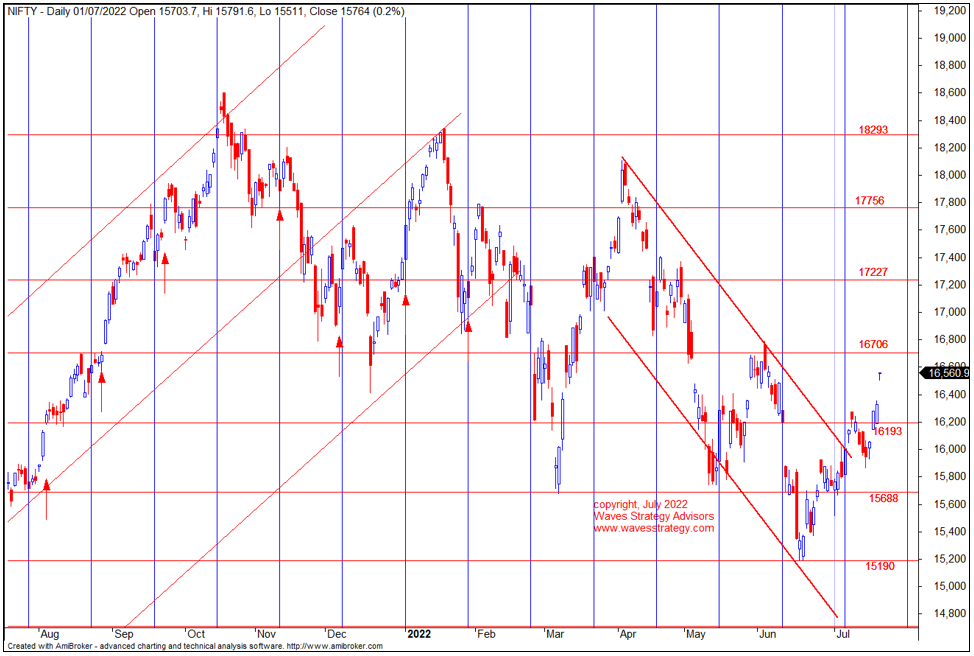
Below chart shows important support and resistance on basis of which trades can be derived using Gann square of 9 methods.
Nifty daily chart:

Gann method - In above chart we can see horizontal lines with price mentioned on it. These numbers are not random but are derived using Gann square of 9 method. The angle used is 180 degrees. This angle has been able to capture most of the important tops and lows.
The intermediate low formed at 15190 was Gann square of 9 level, post that we saw multiple attempts to take support at 15688 which was again a Gann number. Post that the push on upside was halted near 16193 and on 19th July 2022 this level was decisively broken thereby opening up next destination as 16706.
18 Days Time cycle – we can see important upside reversal on most of the occasions in about 18 days. This time cycle has worked well if combined along with Gann square of 9 method. We can clearly see that after bouncing from 15688 the time also turned on buy side on 6th July 2022. So price and time got in sync and Nifty moved from one Gann level to another.
The above simply shows that instead of deriving price action areas by looking at prior tops or lows one can derive using scientific method of Gann square of 9 which is suggesting next zone as 16706. It is not necessary to reach there directly, there can be speed breakers in between but this is where we can see profit booking and reversals.
Learn to Trade using this scientific approach to markets in 3 months of Mentorship which will focus on Gann methods, Time Cycles using Hurst’s methods and Wave concepts. It does not matter even if you are fresher because we will be taking step by step approach to trade markets. Limited seats only, Mentorship starts on 30th July 2022, get immediate access today before the live trading sessions, Fill here form for more details


No comments:
Post a Comment