Nifty Expanding Pattern is a classic technical analysis pattern that results into breaking of previous highs or lows without any meaningful trend. This is the reason why even after breaking important support or resistance prices are not moving in any direction.
Let us see on Nifty 2 Hourly chart this pattern along with different indicators:
Nifty 2 Hours chart:
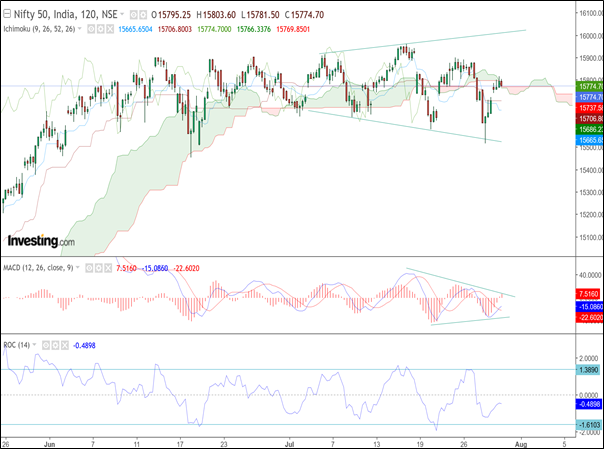
Analysis: During sideways movement it is important to see the oscillator or indicators that can provide reversal areas. We can see that prices are breaking the important supports or resistance but the indicator is still providing reversal clues. We are showing two indicators below the price plot – MACD and ROC. The period of an indicator should be selected on basis of the cycle that it follows. However, over here for understanding purpose we are not tweaking the parameters
MACD, Indicator clearly shows a contracting behaviour where the indicator itself is forming a contracting triangle pattern despite of prices forming expanding pattern. A breakout on the indicator along with price confirmation will increase the conviction that the trend in the direction of breakout has started.
Rate of Change indicator: This indicator shows classic movement between the overbought and oversold region or rather both extreme levels. The upper end of the range is near 1.3890 and the lower end is at -1.6103. One can look forward for buying opportunity near the oversold state and selling opportunity near the overbought state. This strategy has to be confirmed along with the Price pattern or CandleStick formation as well as it is the prices that we are trading and not the indicators. This will save a lot of traders from falling into the pitfall of giving more importance to indicators over prices. Highlighted green and red region on the chart is an Ichimoku Indicator and we will revisit this in subsequent research.
In a nutshell, we can clearly see that by applying these simple methods of Indicators along with prices one can take trades effectively.
WSA Exclusive Offer 2021 – Subscribe to the daily research report and get access to such advanced concepts of Technical analysis with Elliott wave charts. Get access under the special offer and get 30% lower price for combining different research products. Get access here
Do you know the correct way to apply Indicators that can sky rocket your accuracy? Now you have the opportunity to learn these simple powerful techniques from Ashish Kyal, Author (International Book), CMT – USA and equip with this tools like Volume profile, Open interest analysis, Option Trading strategy and Trend following systems in upcoming training on 7-8th August Master of Technical Analysis Season 2.2 (MOTA S2.2) Early Bird Ends tomorrow, Act now if you want to be a profitable trader and apply the science in the way it is supposed to be. Contact +91 9920422202 or Register here


No comments:
Post a Comment