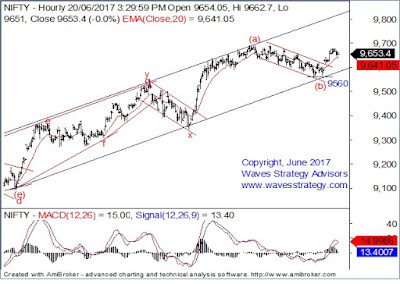
Bottom Line: Nifty managed to sustain the Gap of 19th
and trade in a range in previous session. This will keep the short term trend
positive with 9560 as very important support.
Nifty daily chart:
Nifty 60 mins chart:
Wave analysis:
In the previous update we mentioned that,“Nifty has given upside breakout
from the downward moving channel of last 9 days which suggests resumption of up
move. 9560 is the crucial support level”
Nifty had sideways action in yesterday’s session and prices
oscillated between 9676 and 9643 levels. The Gap of the prior day had been
protected so far which will keep the short term trend positive as long as 9560
level is intact. The top gainers across the sectors were Tata group stocks and
it seems that fresh momentum can be seen in the group companies given a
synchronized move.
On daily chart, you can see two very important moving
averages – 20 days and 5 days Exponential Moving average. Since the trend
started from the lows of 7900 levels in December 2016, the shorter blue moving
average has managed to sustain above the red moving average. Whenever the
distance between the blue and the red averages reduces it provides good
opportunity to trade in the direction of the medium term trend which is on
upside. Even recently the blue moving average came very close to red one and
prices have reversed back. This will keep the trend positive as long as we do
not see decisive break of blue line below the red. This is one of the simplest
trend following method.
Given the above and looking at maturity of trend, position
sizing is important and Time cycles are helping us to understand that. As the
cycles still remain in sell mode atleast till 1st week of July it is
prudent not to leverage much and use a strict stoploss levels. Booking partial
profits as soon as possible and trailing the remaining with prudent stoploss is
best method to use to ensure squeezing the most from ongoing trend.
In short, trend will remain positive as long as 9560 is
intact but at the same time one should keep position sizing under check to ensure
risk is less in case of adverse movement. At times it is better to stay
cautious with lesser number of positions when all the indicators are not in
sync and we will highlight it here when the majority of indicators get
synchronized again for going in with full capacity. As of now stay long and use
9560 as very strict stoploss with less leverage.
Subscribe NOW and see yourself detailed analysis on Nifty and how precisely markets
are moving!
Register for the Most Advanced training on Technical analysis – Advanced Elliott wave, Neo wave combined
with Hurst’s Time cycles and Gann cycle analysis. These techniques will
equip you with tools that can help in increasing the trading or investment
accuracy. Also get insights into lot of practical charts with applied studies
and get access to free research reports post training. This can be one of the
best investments, Limited seats – Enrol Now


No comments:
Post a Comment