Nifty Happened Scenarios:
The below excerpt is picked up from
the “Financial Waves Short term update” report which is published daily before
equity market opens. The below article itself shows the accuracy of levels we
have been mentioning over past 3 days.
Nifty 60 mins chart:
Published on 16th
July 2012:
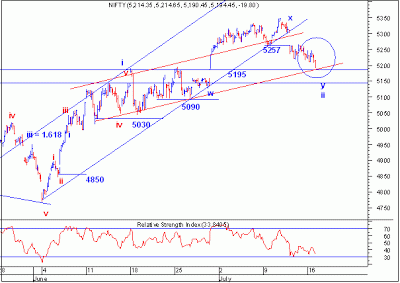
Published on 16th July 2012 before 8:30 am : It is now
important to see if prices can manage to bounce back from the crucial support
of 5200 – 5190
level. This level is an intersection of 2 trendlines as shown in the above
charts. Intersection points are very important and mark the turning points atleast
over short term.
Happened on 16th July: Nifty made a low of 5190.45 and closed at 5197. Prices touched 5190
almost to the point and did not break it.
Nifty 60 mins chart:
Published on 17th
July 2012:
Published on 17th July 2012 before 8:30 am : We now expect
prices to bounce back from here and move towards 5260 – 5270 levels over short term. 5150 - 5190 level was acting as
strong support zone previously in the months of March – April & it acted as
a strong resistance in the month of June. Now this zone should act as a strong
support and prices shall bounce back from here…. A move below 5180 will be bearish…
Happened on 17th July: Nifty made a low of 5181 yesterday and managed to close above 5190 level.
The high made during the day was 5237.
Nifty 60 mins chart:
Happened as on 18th
July 2012 EOD:
Happened on 18th July: Nifty managed to close above 5180 – 5190 level and made a high
of 5223 on intraday basis. Prices have so far defended the important level of 5180 – 5190 on closing basis. For subscribing to this equity report write to us on helpdesk@wavesstrategy.com.


No comments:
Post a Comment