Thursday, August 28, 2025

Missed the Last Rally? Britannia’s Next Wave Might Be Bigger!

When we combining Elliott wave Theory along with price action, does it help us in forming powerful setups?

New traders want to trade and capture every moves & on other hand seasoned ones know the real money lies in sitting tight and try to capture the best of the 3rd wave.

Read the full research report on Britannia below:

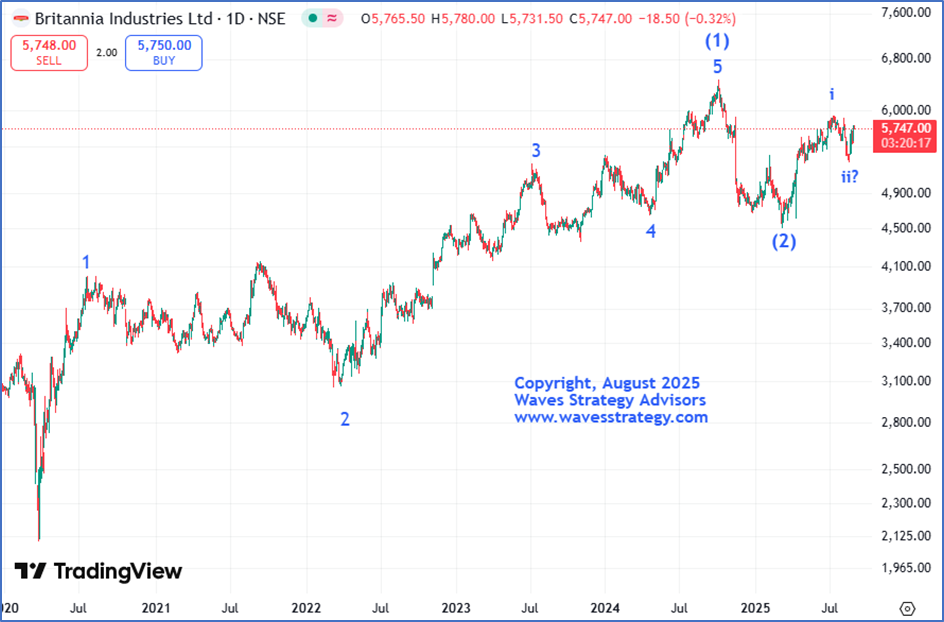
Britannia Daily Chart as on 28th August 2025

Britannia has been in moving as precisely as per our Elliott wave counts. The entire rise post Covid low in 2020 has been impulse in nature. Wherein, wave (1) of Primary degree got completed on the upside in September 2024, post which the entire correction was in the form of Primary wave (2). As the rise in April- May was sharp in nature one can conclude that wave (3) of Primary degree has started to unfold on the upside.

In which, wave a break above 5800 levels can confirm completion of internal wave ii of 1 on the downside. Post which, the rise will be in the form of internal wave iii of 1. According to the guidelines, wave 3 is considered the strongest terminus.

In a nutshell, Britannia is on the verge to give a breakout. For now, a break above 5800 is needed for a trending move to emerge on the upside. On the downside, 5500 levels is the crucial support for the stock.

Brahmastra (Mentorship on Timing the market) – Over period of 3 months equip yourself with all the tools to trade the market with an edge of Time, application of Elliott wave & Neo wave to predict future movements, Options strategy, access to a private community group, stock selection scanner, Multibagger and Momentum stock identification technique. Mentorship sessions for the complete trading journey. Fill the form below for more details: Know more here:

Monday, August 25, 2025

Nifty path ahead using 43 Period Time cycle and Gann levels

When we combine Time cycles with Gann Square of Nine it gives traders an edge. It helps to ahead of the crowd and find important support and resistance levels when prices are in unchartered territory.

The concepts are part of advanced Technical Analysis concepts and it is surprising how it helps to form powerful trade setups with good accuracy.

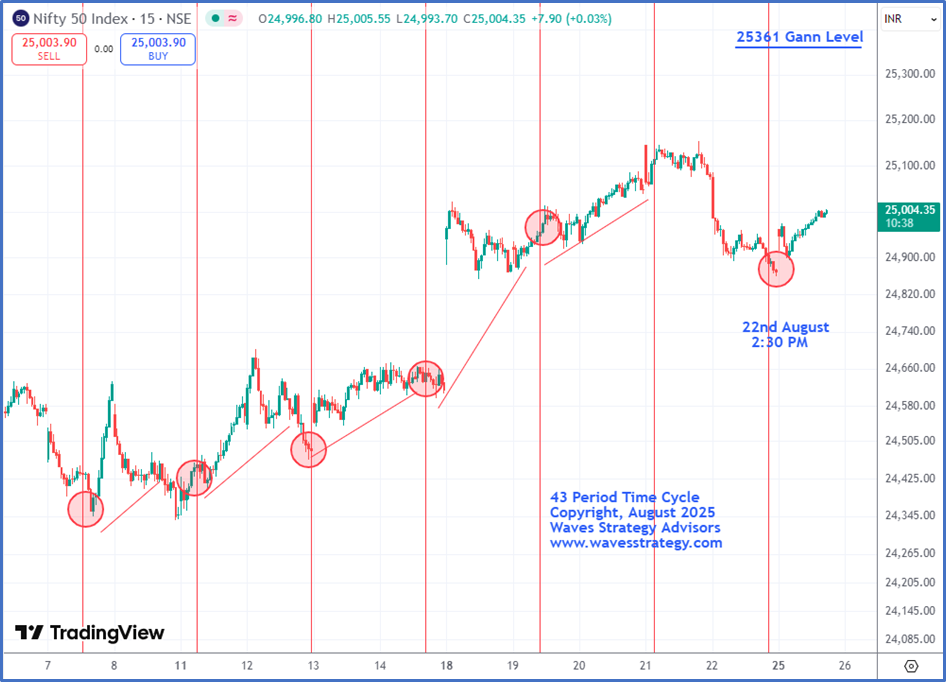
Nifty 15 Min chart with 43 Period Time Cycle and Gann Square of Nine.It is fascinating to see that all of these concepts are fractal in nature as it can used across all time frames.

Overall, Nifty for the past couple of sessions has been stuck within a range of 24860 to 25150 level and has been witnessing wild swing within it.

Now let’s understand it on a shorter time frame -

As one can observe how 43-period Time cycle of Nifty has worked like magic! The Index, majority of the time has managed to form its short-term low near its cycle post which we have seen a pullback on the upside. As of now, the cycle which was due on Friday 22nd August 2025 at 2:30 Pm has already turned on the buy side by break above its previous swing high of 24980 levels and for now one can expect that with follow up buying prices can reach the upper end of the mentioned range i.e. near 25150 levels. Post breaking that, we can expect Nifty to make an attempt to reach its next Gann level of 25361 levels. On the downside, 24860 remains as the important Time support.

Brahmastra (Mentorship on Timing the market) – Over period of 3 months equip yourself with all the tools to trade the market with an edge of Time, application of Elliott wave & Neo wave to predict future movements, Options strategy, access to a private community group, stock selection scanner, Multibagger and Momentum stock identification  technique. Mentorship sessions for the complete trading journey.Fill the form below for more details Know more here:

Thursday, August 21, 2025

Time Cycle Magic! Paytm Surges 21% Exactly as Forecasted

Time Cycles is a very important Technical Analysis study and is surprising that such basic concepts are rarely focused by traders. When we combine Time cycles with price action, we can see witness interesting results.

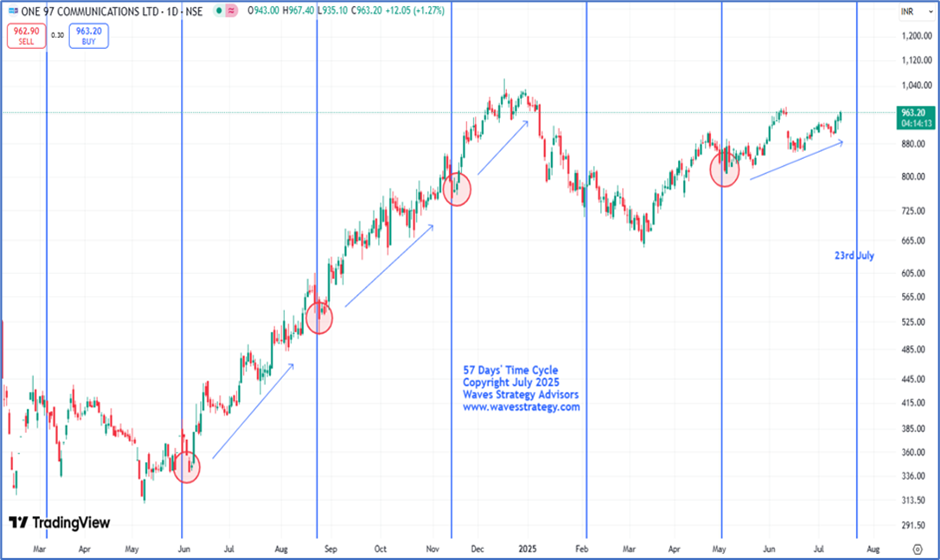
In the month of July 2025, we anticipated a possible short-term bottom to form in Paytm with the help of 57 period Time cycle which we mentioned in our previous article, published on 14th July 2025.  Read the below article for the detailed research.

Paytm Daily Chart: Anticipated as on 14th July 2025Paytm Daily Chart: Happened as on 21st August 2025Anticipated as on 14th July 2025

We can see how 57-Days’ Time cycle has worked wonderfully on this stock. Most of the time near from the cycle zone we have seen a bounce on the upside. The recent low was also captured by our cycle near 807 levels and since then we have seen a rise of more than 20%. For now, next date and time to track is on 23rd July 2025. Around this time one can see the pattern and price action and if favourable can pull the trigger to capture another move in PAYTM on the upside.

In nutshell, the medium-term trend for PAYTM is likely to remain on the positive side. One should look for buying opportunity near cycle zone i.e. 23rd July 2025 to enter into fresh long position.

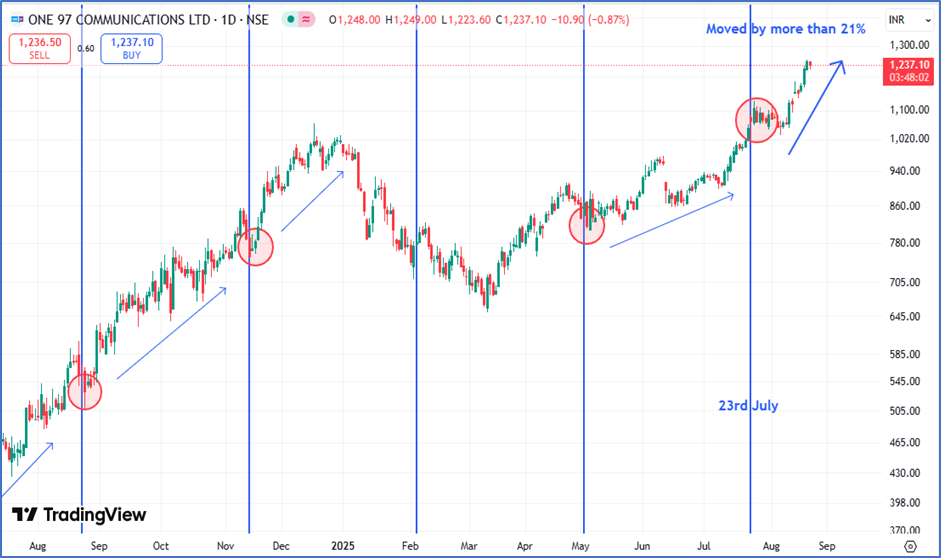
Happened as on 21st August 2025

The stock behaved precisely as expected. Paytm formed a short-term low near of 1032 levels which near our cycle low due on 23rd July 2025 and BANG ON!! Following which, prices saw an exponential rise of more than 21% marking a strong impulsive move. This states the magic of time trading!

Want to know more about such stocks on the mark! subscribe to our Vayu Short-Term Update: Get a list of stocks with high growth potential: Check Here

Kaal Chakra (Master of Cycles) – Learn the science of Hurst’s Time cycle along with Gann square of 9, KST momentum indicator, Pring Special Time indicator, FLD for price target in upcoming 23rd – 24h August 2025 training sessions – know more over here

Brahmastra (Mentorship on Timing the market) – Over period of 3 months equip yourself with all the tools to trade the market with an edge of Time, application of Elliott wave & Neo wave to predict future movements, Options strategy, access to a private community group, stock selection scanner, Multibagger and Momentum stock identification technique, Mentorship sessions for the complete trading journey. Fill the form below for more details Know more here:

Monday, August 18, 2025

Trust the Process: How M&M Became a Multibagger in Just 1.6 Years!

 We featured Mahindra and Mahindra Industries in our Jal Multibagger Stock Report published on 22nd February 2024, highlighting its strong potential to deliver Multibagger returns within 1–2 years.

Since then, the stock has not only sustained its uptrend but has also rewarded investors handsomely by delivering over 91% return within the span of 1.6 years. In today session, Mahindra and Mahindra hit lifetime high of 3432 levels, see below how we identified this stock.

Mahindra and Mahindra Ltd weekly Chart (Log Scale): Anticipated as on 22nd February 2024
Mahindra and Mahindra Ltd Daily Chart: Anticipated as on 22nd February 2024
Wave Analysis as on 22nd February 2024:

Multi-bagger stock recommendation: Mahindra and Mahindra Ltd 

Buy Price – Buy at CMP 1910 more on dips towards 1620 level.

Time Horizon –1 to 2 years

Investment – 5% of capital

Target price - 3430 levels             

Stop loss – 1140 levels

Mahindra & Mahindra is an Indian multinational automotive manufacturing corporation headquartered in Mumbai. It was established in 1945 as Mahindra & Mohammed and later renamed Mahindra & Mahindra. Part of the Mahindra Group, M&M is one of the largest vehicle manufacturers by production in India. Its unit, Mahindra Tractors, is the largest manufacturer of tractors in the world by volume. The main reason to include this stock in the update is because the stock has given multi fold returns over the years. It has potential to continue to do so in coming years.

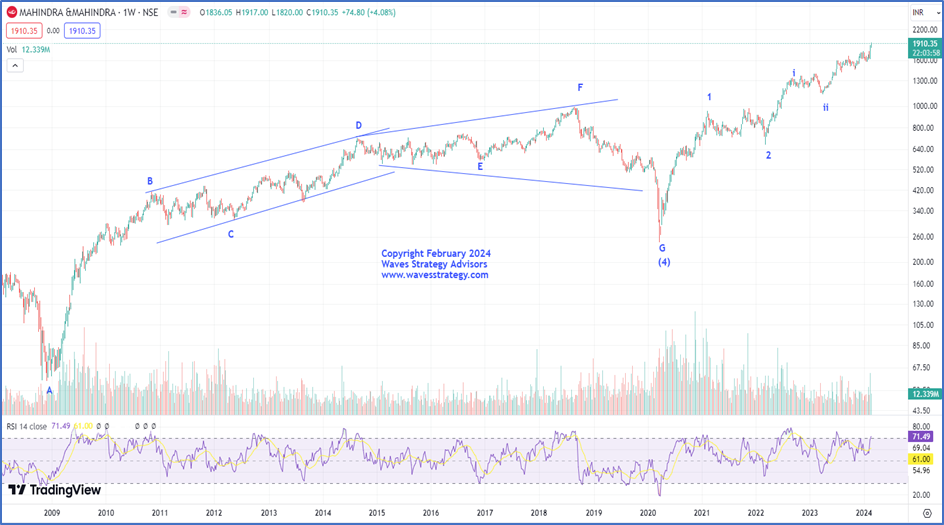
Let’s us understand view for M&M with the help of advance technical tools. As per wave perspective, stock is following classic Elliott wave theory. Wherein, primary wave (4) got completed near 245 levels and currently wave (5) is ongoing. This is one of the reasons why we have seen strong outperformance by this stock in the current rally. Furthermore, this wave (5) has been sub-divided into 5 waves, of which wave 3 of iii is ongoing. Crucial support is at 1140 which is also a low of minor wave ii.

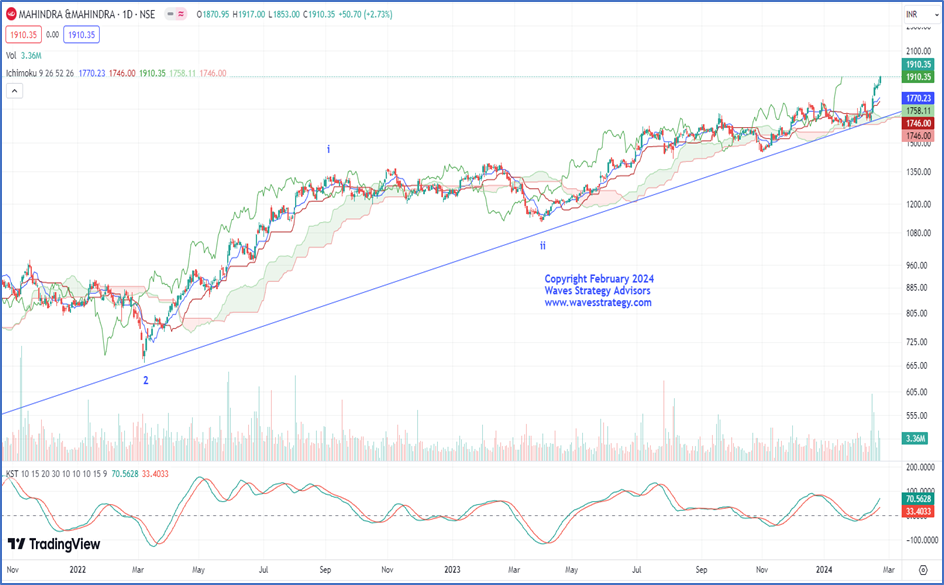
We can observe from the above chart, that the Multimonth trendline has proven to be effective. Since it has consistently offered support. Prices recently found support at that level, and a strong rebound

was observed. Apart from this, KST indicates that strong momentum is likely to continue because it is trading above the zero-line following the crossover.

In short, the trend for Mahindra & Mahindra is positive for the conservative target of 3430 as long as 1140 levels remains intact on downside. Buying can be done in staggered fashion at CMP 1910 and more on dips towards 1620 levels in this stock.

Mahindra and Mahindra Ltd Weekly Chart: Happened as on 18th August 2025:
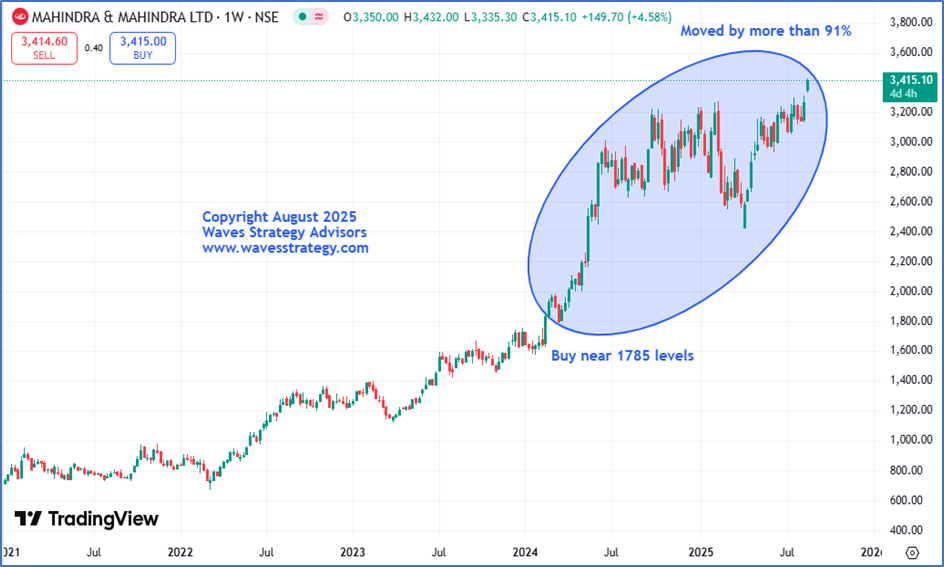
Mahindra and Mahindra Ltd has performed exactly in line with our expectations, delivering exceptional returns of more than 91% in 1.6 years and BANG ON!! The stock showed one side rally and achieved our given target of 3430 levels which was near its fresh record levels. The overall up move has been strong with a higher high and higher low formation which keeps the Primary trend on bullish side as per the Dow Theory.

Kaal Chakra (Master of Cycles) – Learn the science of Hurst’s Time cycle along with Gann square of 9, KST momentum indicator, Pring Special Time indicator, FLD for price target in upcoming 23rd – 24h August 2025 training sessions – know more over here

Brahmastra (Mentorship on Timing the market) – Over period of 3 months equip yourself with all the tools to trade the market with an edge of Time, application of Elliott wave & Neo wave to predict future movements, Options strategy, access to a private community group, stock selection scanner, Multibagger and Momentum stock identification technique, Mentorship sessions for the complete trading journey Know more here
Wednesday, August 13, 2025

Missed Nifty’s Jump? Here’s the Exact Setup That Caught It

Time Cycles are a powerful tool in technical analysis that help traders identify potential market turning points. When Time analysis is combined with price action it helps traders to form efficient trade setup which helps to capture early reversals.

Below is the chart which shows a detailed path of Nifty which we discussed in our past weekly webinar held on 12th August with 1000’s of participants.

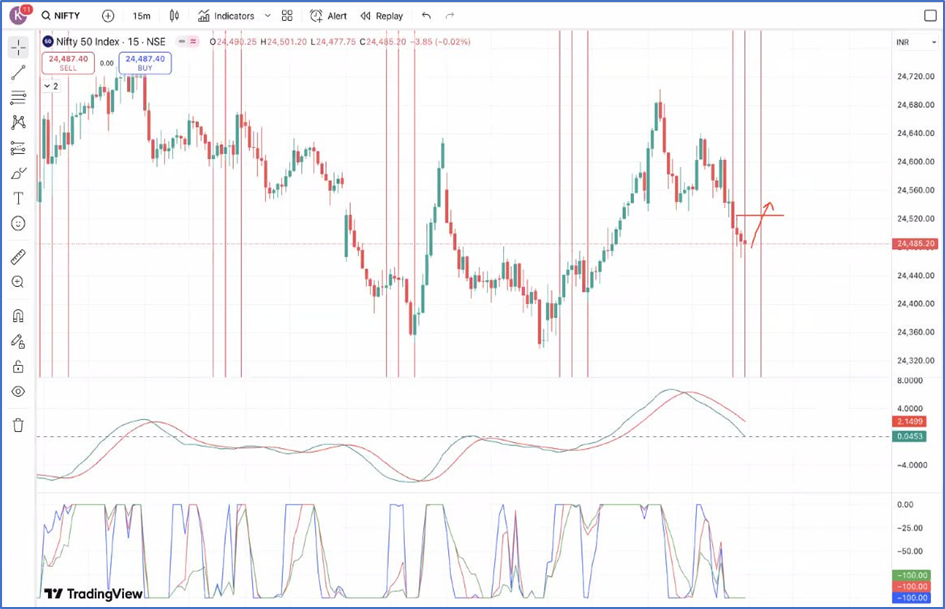
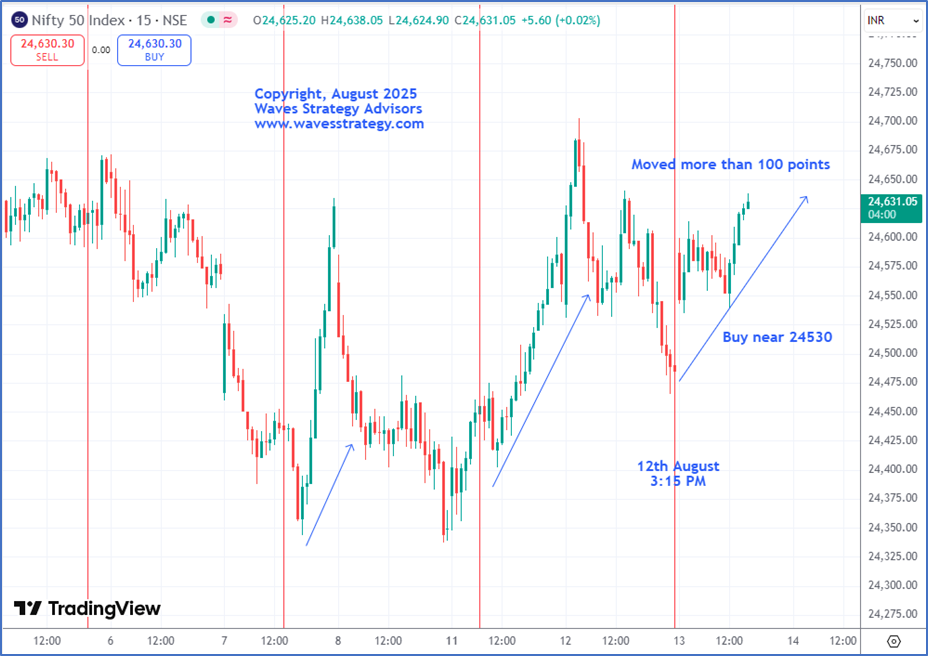
Nifty 15 min chart: Anticipated as on 12th August 2025Nifty 15 min chart: Happened as on 13th August 2025Time cycle are fractal in nature which means it can be plotted and used across all time frames. For Nifty, 43 period of Time cycle works extremely well on the 15-min Time frame. When majority of the crowd was bearish side, we projected a up move in the Index in front of the 1000’s of participants.

As anticipated, prices formed a short-term low of 24460 levels near our cycle zone which was due on 12TH August 2025 post which we saw a pullback on the upside and BANG ON!!  Prices witnessed an exponential gain of more than 100 points in a single day! This is the power to Time trading!

In nutshell, by using science of Time cycle with price action one can stay ahead of the crowd as it can predict lows prior than it has already happened.

For such Nifty levels and strategic insights, join our Agni Membership where you get expert analysis and actionable levels. Click here.

Brahmastra (Mentorship of 3 months) on Timing the market – Learn to time the market to the very Day, Hour and Minute by combining the concepts of Hurst’s Time cycle, Gann square of 9, Elliott wave, Neo wave and be a part of elite trader’s community who are Time Traders. Limited seats only, Early Bird offer Ends soon: Know more here