Monday, July 7, 2025

Precision Pattern Trading: How Raymonds Delivered 20% in Just 2 Days

 When one combines basic Price patterns with technical indicators like MACD (Moving Average Convergence Divergence) it leads to interesting results. Our recent analysis on Raymond Lifestyles Ltd, affirms this theory and by using this simple trade set up one can trade more confidently. Check out how this stock rallied by more than 20% after our prediction.

We published the following research on Raymond Lifestyle Ltd on 27th June 2025 in the “Vayu Momentum Report” which our subscribers receive pre-market every day.

Raymond Lifestyle Daily Chart Anticipated as on 27th June 2025
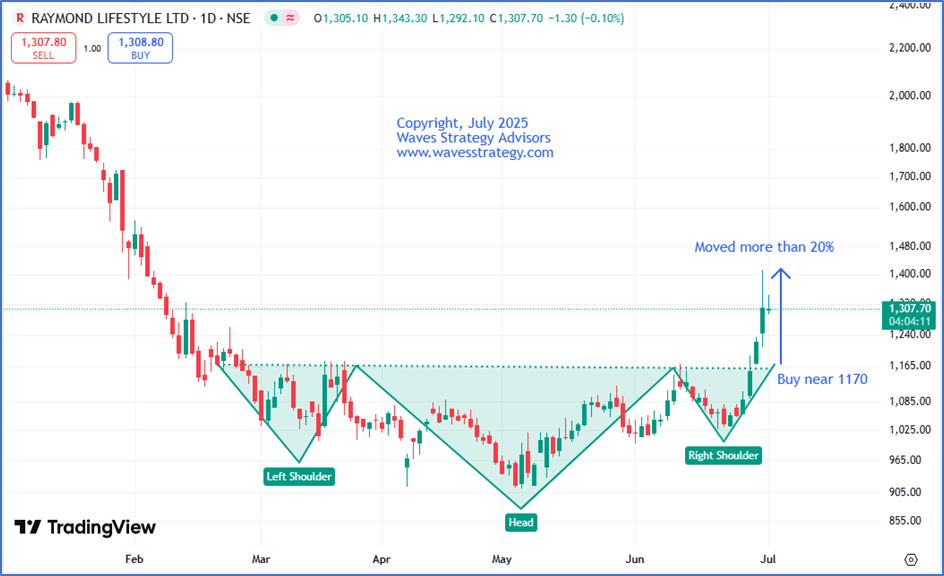
Raymond Lifestyle Daily Chart Happened as on 1st July 2025
Wave analysis as on 27th June 2025-

In the previous session, RAYMONDLSL prices rose by nearly 6%, backed by a significant rise in the volumes which is the highest volume till the date. On the daily chart, over the past 6 trading sessions, the stock has shown a strong buying interest, with prices protecting a previous candle’s lows on a closing basis.

On the daily chart, the stock is forming an Inverse Head and Shoulder pattern, a classic reversal pattern, since February 2025. Although prices attempted to break out of it in the previous session but failed to give a close above the neckline of 1177 levels. So, a close above this level can confirm the pattern breakout and we can see upside movement. If this happens then according to the pattern target comes near 1340 levels which is length of the right shoulder.

Additionally, in the recent session, MACD has witnessed a bullish crossover as MACD line(blue) crossed above the signal line(red) working as a double confirmation for our stance. Post consecutive two days of rally, buying on dips looks like a prudent strategy.

In a nutshell, Overall tone for the stock is bullish. Post inverse H&S breakout upside strong rally is expected with the short-term targets’ of 1260 levels. On the downside, 1100 levels is the nearest support to watch out for!

Happened as on 01st July 2025:

Raymond Lifestyle has been in sync with our expectations. After a minor dip towards the neckline which we mentioned, prices reversed on the upside and BANG ON!! The stock moved as expected and not only achieved our both given target but also made a high of 1411 levels which suggests that bulls are increasing their stake in the stock. In the end, we were successful in capturing a move of more than 20% in just 2 trading sessions with the help of such simple price pattern and indicator.

It is fascinating to see how accurately Simple price patterns along with simple indicators can help to predict price targets with accuracy.

To know such short-term picks, subscribe to our Vayu Momentum report

Sutra of Waves – (Elliott wave with Neo wave) live session on 12th 13th July 2025 – You cannot miss learning this science completely and equip with such powerful forecasting methods that actually work. Neo wave is ultimate step towards trading successfully and missing element in your trade cycle. Limited seats only, Register here

Trishul membership consists of Options Mantra, Elliott wave, Sutra of Wave Know more here

Tuesday, June 24, 2025

Nifty Targets done! Will it go up?

 It is fascinating to see how with the help of Neo wave one can anticipate a move before it happens on Indices and even on Commodities.

We have been tweeting about Nifty and Crude Oil movement from time to time on my twitter (X) handle @kyalashish and the move has been just precise. See the details about it below:-

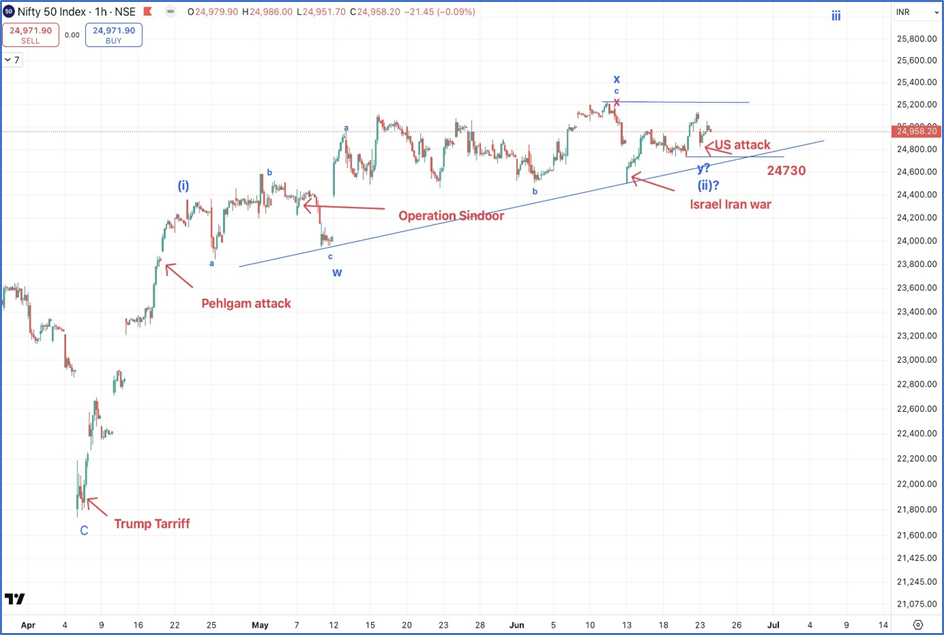
Nifty Hourly chart: Anticipated in a Tweet as on 23rd June 2025
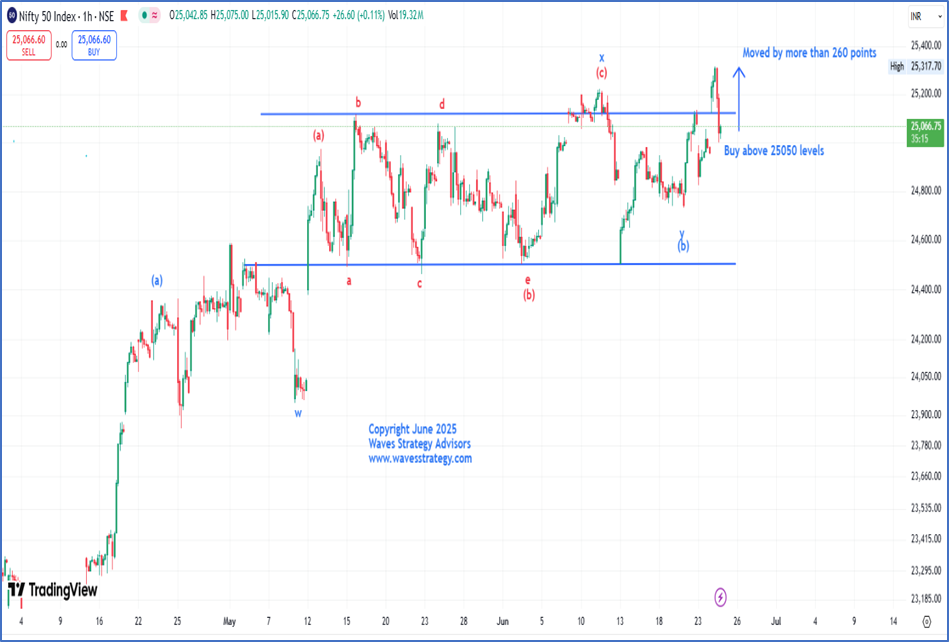
Nifty Hourly chart: Happened as on 24th June 2025
In the 1st chart, we have shown possible path for Nifty which was tweeted on 23rd June 2025, where we anticipated that if Nifty manages to give sustainable close above 25050 levels then it can lead to a move towards of 25200 or higher which will be in the form of wave (iii).

Bang on! Nifty continued to move higher post achieving target of 25200 and prices made high of 25317 levels in today’s session. As per the wave theory, wave (iii) has started to unfold on the upside but for now, we need broader participation and a daily close above 25200 levels for buying to continue.

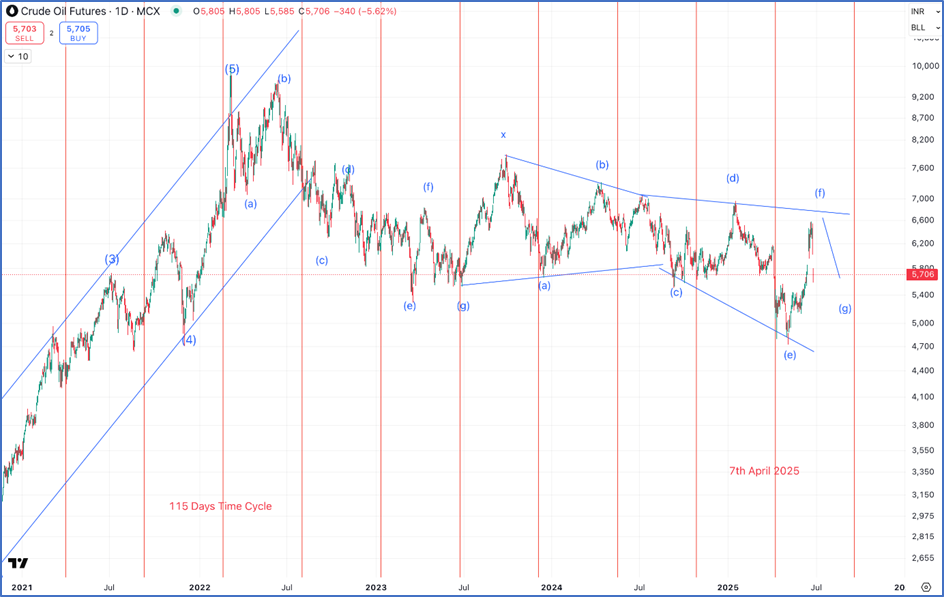
Crude Daily chart: Anticipated in a Tweet as on 20th June 2025
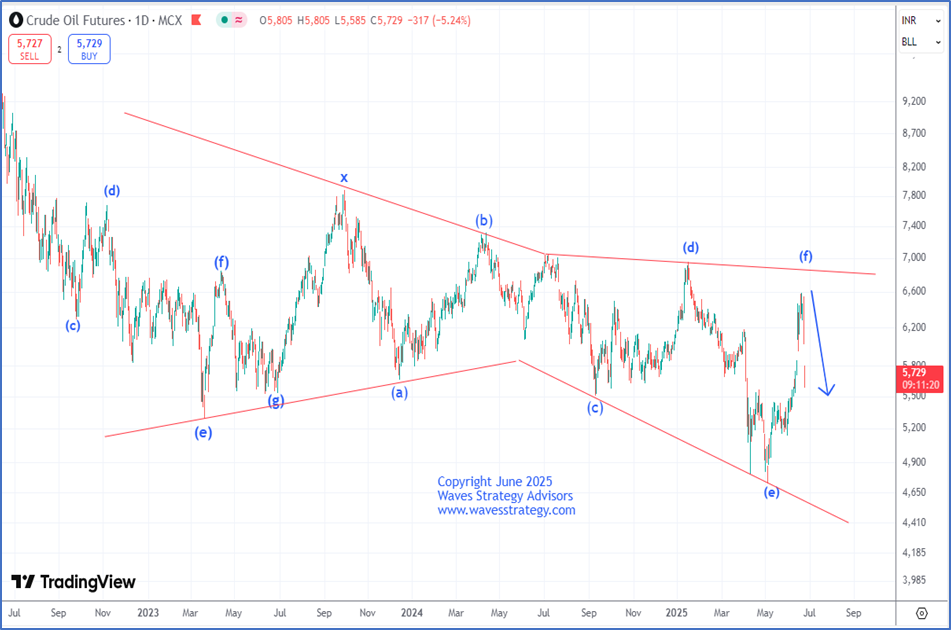
Crude Daily chart: Happened as on 24th June 2025
The second anticipated chart is of Crude Oil of 20th June 2025, in which we showed a possible path ahead using Neo wave counts. Bang on!

Prices completed wave (f) on the upside and we have seen a sharp fall of more than 14% in just 2-3 days from the high of 6550 levels, post the news about the Ceasefire between Iran and Israel came out. However, we predicted about the possible correction when prices were trading at the top, when no one was expecting it.

For now, as per the guideline, wave (g) tends to mimics wave (a) which further leaves room for the asset to move on the downside.

AGNI (index) Research - Get access to daily research reports on Nifty along with charts, and options strategy. Know more.

Sutra of Waves – (Elliott wave and Neo wave) SOW program will focus on application of Elliott wave / Neo wave along with Ichimoku cloud, Fibonacci trading system, forecasting from intraday to swing trading strategy, 12th – 13th July for live training but access to Elliott wave is given on immediate basis. Limited seats only, Early bird ends on 25th June 2025. Know more here

Trishul membership consists of Options Mantra, Elliott wave, Sutra of Wave, Know more here

Monday, June 23, 2025

M&M path ahead using Advanced Elliott wave!

 When we combining Advanced Elliott wave Theory along with price action, does it help us in forming powerful setups?

Neo wave is an advanced Elliott wave that provides forecasting ability. This ability helps to form powerful setups when used with simple price action.

New traders want to trade and capture every moves & on other hand seasoned ones know the real money lies in sitting tight and try to capture the best of the 3rd wave.

See the detailed research below on Mahindra and Mahindra Ltd 

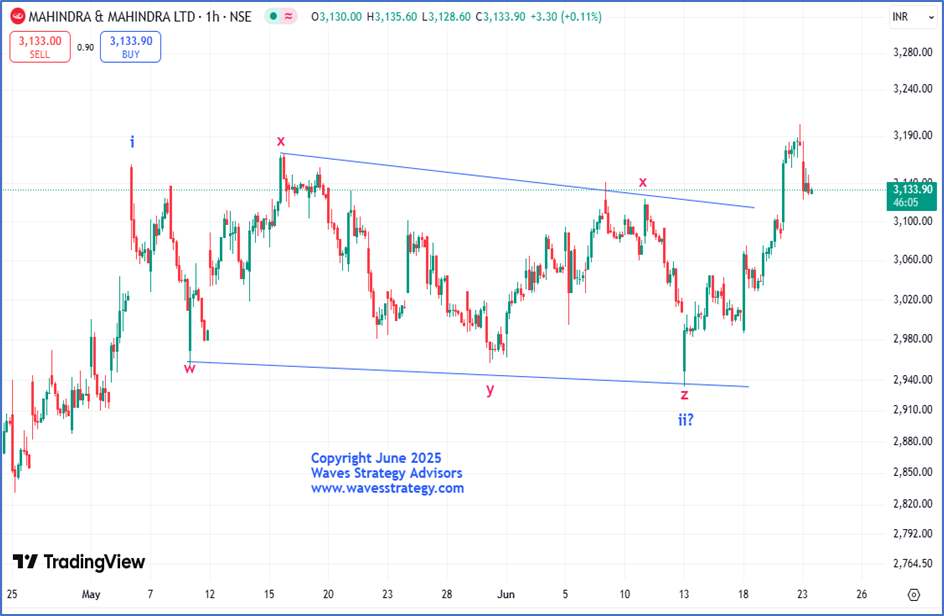
Mahindra and Mahindra Hourly Chart
Advanced Elliott wave is the GPS of the market that helps to understand the overall maturity of the trend. We can see how M&M has been moving in sync with our counts. Post completion of wave i (blue) on the upside in May 2025. The entire correction has been in the form of wave ii which is further subdividing in nature. Wherein it looks to be in the form of a double complex correction pattern (w-x-y-x-z). As of now, a decisive break above 3170 levels is needed to confirm about the completion of wave ii on the downside. Post which, the rise will be in the form of wave iii which is considered to be the strongest wave as per the guidelines.

As wave iii(blue) can go up to 161.8% of wave i (blue) derives us the target of 3390 levels on the upside. On the downside, 2990 levels is the crucial support for the stock.

In nutshell, we can conclude by saying that when Price and Elliott wave are in sync it can lead to interesting results even in stocks. 

Want to know more about such stocks M&M is on the mark! subscribe to our Vayu Short-Term Update: Get a list of stocks with high growth potential: Check Here

Sutra of Waves – (Elliott wave and Neo wave) SOW program will focus on application of Elliott wave / Neo wave along with Ichimoku cloud, Fibonacci trading system, forecasting from intraday to swing trading strategy, 12th – 13th July for live training but access to Elliott wave is given on immediate basis. Limited seats only, Early bird ends on 25th June 2025. KNOW MORE

Trishul membership consists of Options Mantra, Elliott wave, Sutra of Wave. KNOW MORE

Thursday, June 19, 2025

JK Cement Ltd Multibagger stock moved by more than 45% within 5 months!!

 We published about JK Cement Ltd in our Jal Multibagger stock report and predicted the possibility of multi-bagger returns in the coming 1-2 years. Check out the below research we published on 29th January 2025.  

This stock has managed to hold its gain and gave more than 45% returns in less than 5 months and made a lifetime high of 6145 levels.

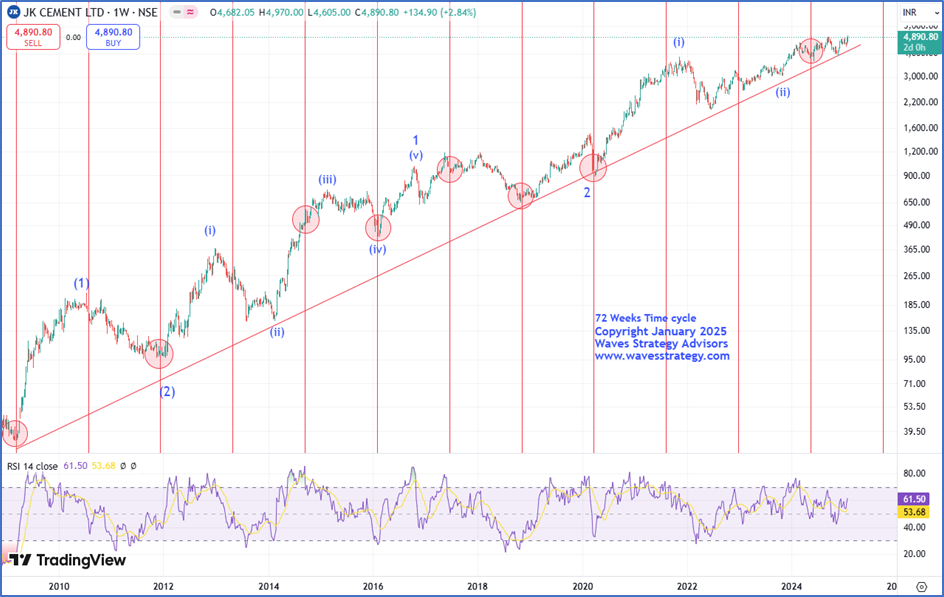
 JK Cement Ltd Weekly Chart Anticipated with Time cycle and Elliott wave as on 29th January 2025
Wave Analysis as on 29th January 2025

Multibagger stock recommendation: JK Cement Ltd

Buy Price – Buy at CMP 4890 more on dips towards 4100-4150-level.

Time Horizon – 1 - 2 years

Investment – 5% of capital

Target price –?????

Stop loss –?????

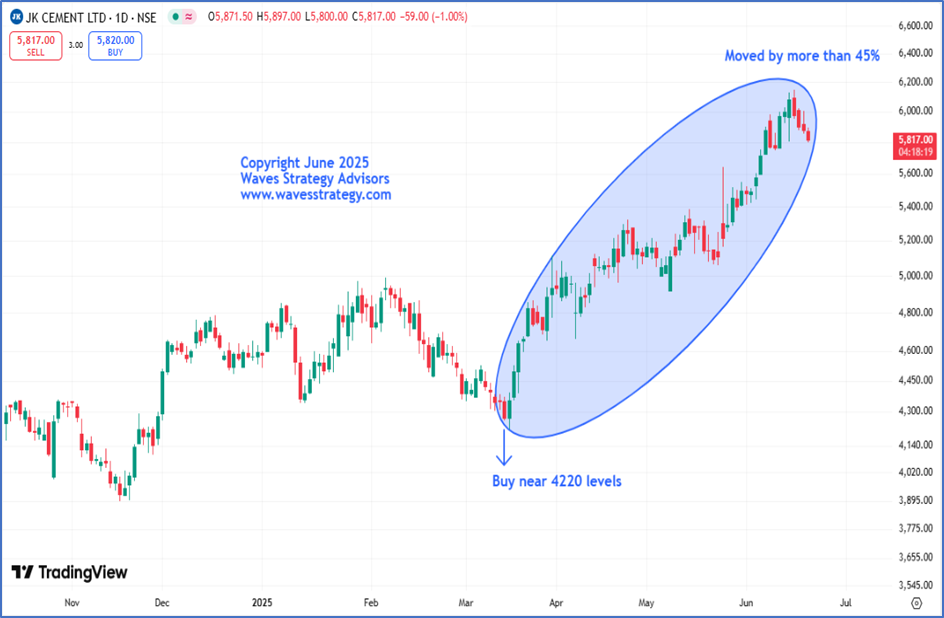
JK Cement Ltd Daily Chart: Happened as on 19th June 2025
Anticipated wave Analysis as on 29th January 2025:

JK Cement Ltd. is one of India’s leading manufacturers of Grey Cement and one of the leading White Cement manufacturers in the World. JK White Cement is sold across 43 countries around the globe and the Company has a strong international presence. They have been a leader in India's cement industry since 1975.

Cement sector is booming since past few weeks. Wherein, JKCEMENT is on the verge to give breakout. Let us understand detail analysis for the stock using advance technical tools like Elliott wave and Time cycle.

Elliott Wave Theory: JK Cement is a classic example of impulse method and has shown exceptional rise from its low made near 102 levels in form of wave (2). After which, the entire rise is in form of wave (3) which is further subdividing. Wherein, currently we are in wave (iii) of 3.

Stock is following 72 Weeks’ Time cycle precisely as it has captured almost all the important lows in this rise which is clearly visible on the above chart. Recent low which was made in May 2024 which was near 3790 levels. From where a good upside move was seen. The next cycle is due by 29th September 2025.

In nutshell, it is ideal to accumulate JK Cement as it has continued to sustain at higher levels and continued to outperform irrespective of market conditions. One can invest in this stock in staggered fashion at cmp 4890 and more on dips towards 4100-4150 levels with maintaining proper stop near ??? levels to capture a move towards ??? levels eventually. (The mentioned levels are mentioned in our Jal Multibagger report.)

Happened as on 19th June 2025

JK Cement was in sync with our expectations and has delivered exceptional returns. After a dip, stock witnessed an exponential rise, rallying more than 45% from the lows of 4220 levels in less than 5 months of our report’s publication.

Moreover, on 16th June 2025, prices managed to make a lifetime high of 6145 levels and now prices are trading near 5830 levels despite high market volatility. The overall up move has been strong and we expect prices to achieve its target of ….. levels in the coming months.

We were able to capture this move by using advanced tools like Elliott wave and Time cycles. By using Time cycle and wave theory together it helps to form powerful trade setups with accuracy.

Want to know more about such stocks like JK Cement Ltd! Subscribe to our Jal Multibagger stock report. Get a list of stocks with high growth potential: Check Her

Trishul Membership - Transform the way you trade with the power of Neo Wave forecasting, In-depth training on Ichimoku Cloud, Elliott Wave, Master of Technical Analysis and the 5 Mantras of Options KNOW MORE

Nifty At Crucial Juncture - Neo wave With Time Cycles

 Nifty has been consolidating in a broad range for more than a month now. Advanced Elliott wave – Neo wave can provide perspective on maturity of trend and exact levels to enter.

Hurst’s Time cycle along with Neo wave is GPS of the market and is providing 4th July 2025 as an important date.

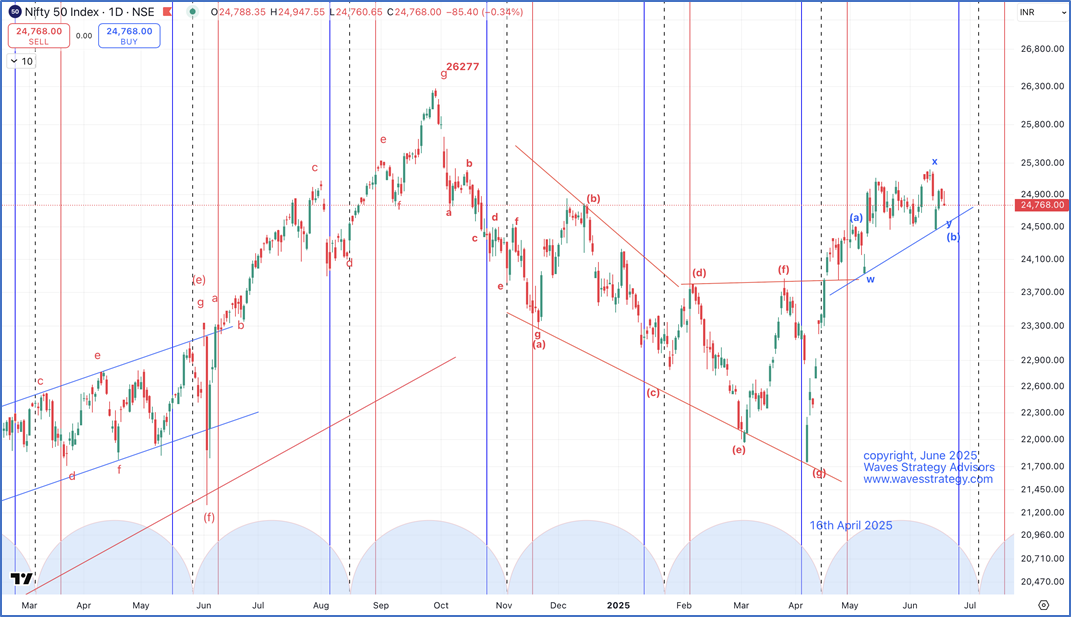
Nifty daily chart:Nifty hourly chart:Nifty daily chart shows that post forming a low near 21740 on Trump Tariff there has been a sharp bounce back on upside. This also happened to be near 85 weeks time cycle. We turned bullish near 22200 levels and from there the index has rallied by almost 3000 points.

The entire up move took out the previous swing in faster time that suggests that the medium term trend on upside as per Neo wave 2 stage confirmation method. There has been extended consolidation and it seems momentum will build post 4th July 2025.

Hurst’s Time cycle – Every 55 days prices have a tendency to move on upside. The prior low formed near 21740 was also within the cycle zone. So, there is possibility that major momentum will generate post the low again near 4th July onwards.

Neo wave - Over short term we are seeing short term correction in the form of complex corrective pattern as shown on hourly chart. Short term trendline support is near 24600 levels. Prices are moving in form of wave (b). This is subdivided into w-x-y. Post completing wave (b), a strong wave (c) on upside should start.

In a nutshell, Nifty is at crucial juncture. Break above 24980 will confirm faster retracement and will strongly hint towards start of wave (c) higher towards 25500 levels. On downside 24600 is going to be important support. Below this expect correction until 4th of July before upside reversal!

Sutra of Waves – (Elliott wave and Neo wave) SOW program will focus on application of Elliott wave / Neo wave along with Ichimoku cloud, Fibonacci trading system, Forecasting from intraday to swing trading strategy, 12th – 13th July for live training but access to Elliott wave is given on immediate basis. Limited seats only, Early bird ends on 25th June 2025.

Trishul membership consists of Options Mantra, Elliott wave, Sutra of Wave. KNOW MORE