Thursday, June 5, 2025

How to trade Nifty with Volume profile and Open Interest?

 How to trade Nifty with Volume profile and Open Interest?

Nifty volume profile is used to infer Big player activity which can be used across all time frame. Traders can use this analysis for taking Intraday and Positional trades.

Options Trading with Open Interest and Volume profile is one of the classic ways to trade.

Nifty Futures Hourly chart with Volume Profile analysis
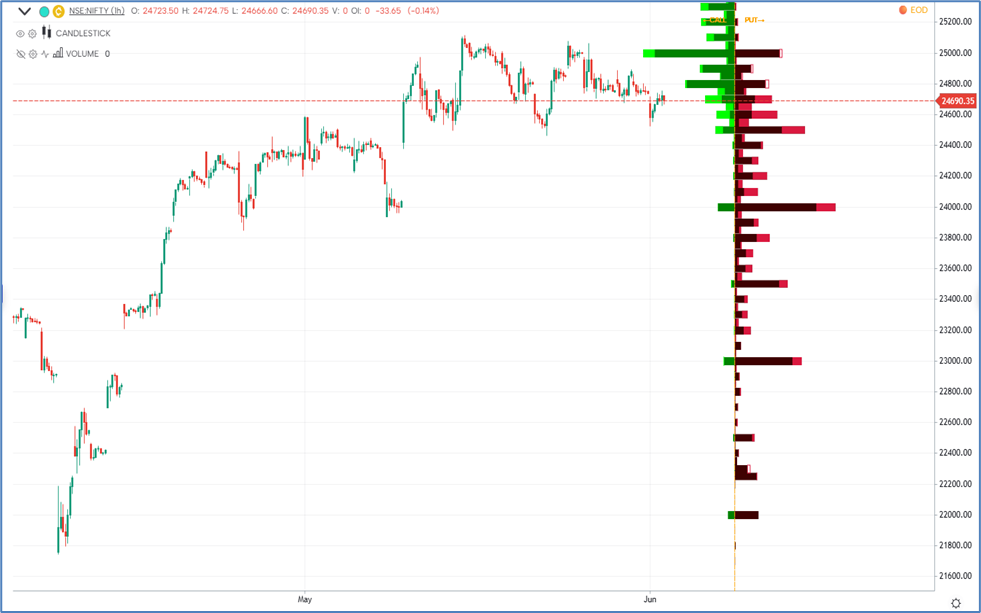
Nifty Hourly chart with Open Interest analysis:
Options Trading requires understanding of momentum, trend, time to expiry and range.

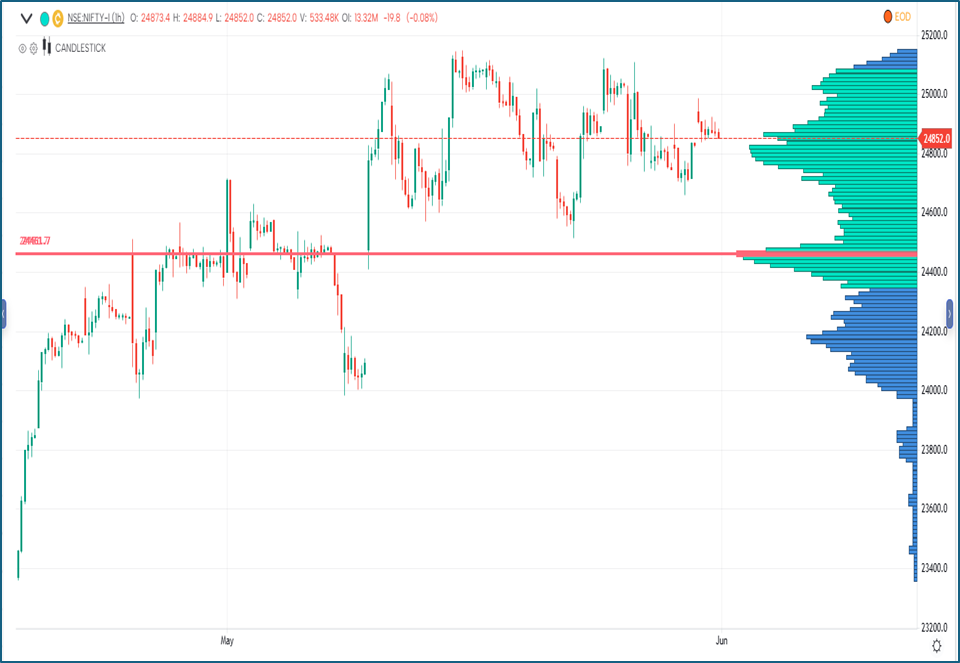
Volume Profile chart shows that there is big players activity near 24500 (fut) levels. Prices are currently trading above Volume point of control (VOC) which is the highest volume node indicating exact level where positions are created by big players. For now, a decisive break below it i.e. near 24500 levels can lead to a panic selling.

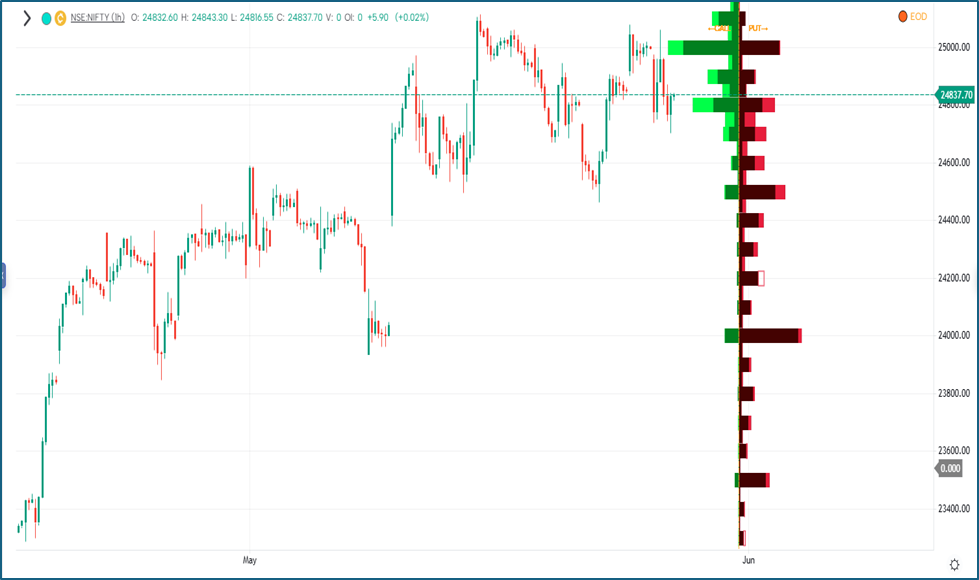
Open interest - showcases the total number of outstanding contracts for a specific stock/index at any given time. On the above chart we can see that 24800 followed by 25000 has highest call build up and on the downside 24500 has highest put buildup suggesting range bound action.

Open interest and Volume profile are both indicating similar outcome and shows areas where big players are creating their positions. This is behind the scene analysis and gives the much-needed conviction for trend identification and reversal areas.

In nutshell, Nifty is expected to remain in a range of 24460-25100 levels. In such scenario buying naked option won’t work due to IV spike. So, one should create strangle to get advantage of the range bound action.

So, by combining big players activity seen from Open interest profile, Volume profile along with Simple price action one can form clear trading strategy which is must for trader to derive stop, targets and favorable risk reward.

Trishul Membership - Transform the way you trade with the power of Neo Wave forecasting, In-depth training on Ichimoku Cloud, Elliott Wave, Master of Technical Analysis and the 5 Mantras of Options. KNOW MORE

How to trade KST Indicator with Keltner Channel Breakout on Bank Nifty?

 Bank Nifty has been experiencing high volatility since the past week. How to catch momentum amid such wild swings?

This setup helps traders to catch the momentum early so that they can fetch maximum gains in minimum time after the signal.

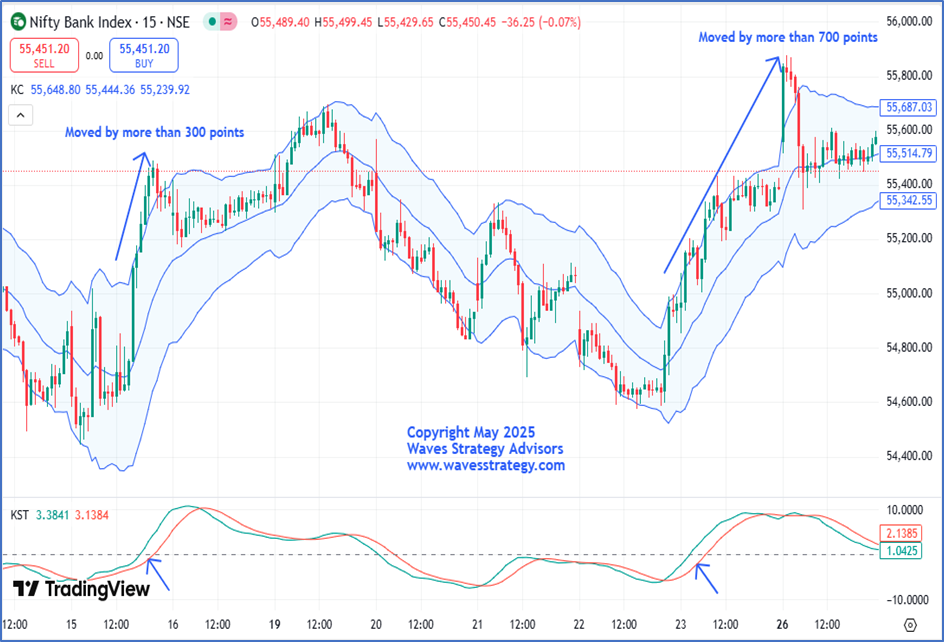
Bank Nifty 15 minutes chart:

In the above chart of Bank Nifty, we can see two important indicators that are focused on prices and momentum. This strategy usually works on Intraday and even on stocks and Indices.

Keltner channel – This indicator is different than that of Bollinger Bands®. Bollinger Bands uses standard deviation to the mean whereas Keltner channel is derived using Average True Range (ATR). Both of the indicators have different ways of application.

In Keltner channel, we can see on 15th May that prices broke above 55175 levels which was above the upper boundary of the channel and we saw a movement of more than 300 points on a single day. Also, on 23rd May 2025, we witnessed the same breakout and saw a movement of more than 700 on the upside. Along with this, we have applied KST momentum indicator which has worked out wonderfully with the Keltner channel breakout which gives an amazing setup. So, KST momentum indicator broke above 0 line and also the signal line (red line) thereby giving strong confirmation that momentum is picking on upside.

In a nutshell, Keltner channel helps to understand if the size of candle is increasing which is suggesting a significant move and KST further provides confirmation of momentum.

Trishul Membership - Transform the way you trade with the power of Neo Wave forecasting, In-depth training on Ichimoku Cloud, Elliott Wave, Master of Technical Analysis and the 5 Mantras of Options. KNOW MORE

How to catch Momentum using Ichimoku cloud Setup?

 Is it possible to capture good moves in stocks using Ichimoku cloud setup? See how this setup worked wonderfully on the below chart.

Ichimoku cloud - The Ichimoku Cloud is a technical tool that indicate the support and resistance, identifies trend direction, gauges momentum and provides trading signals.

What is an Ichimoku cloud setup?

This setup aims to catch the trend early as an eagle waits for the exact moment to catch the prey most of the time. This setup requires price to witness a dip toward the cloud, reverse upward, and then deliver a decisive breakout above its previous swing high."

MMTC 15 Minutes Chart with Ichimoku Cloud setup

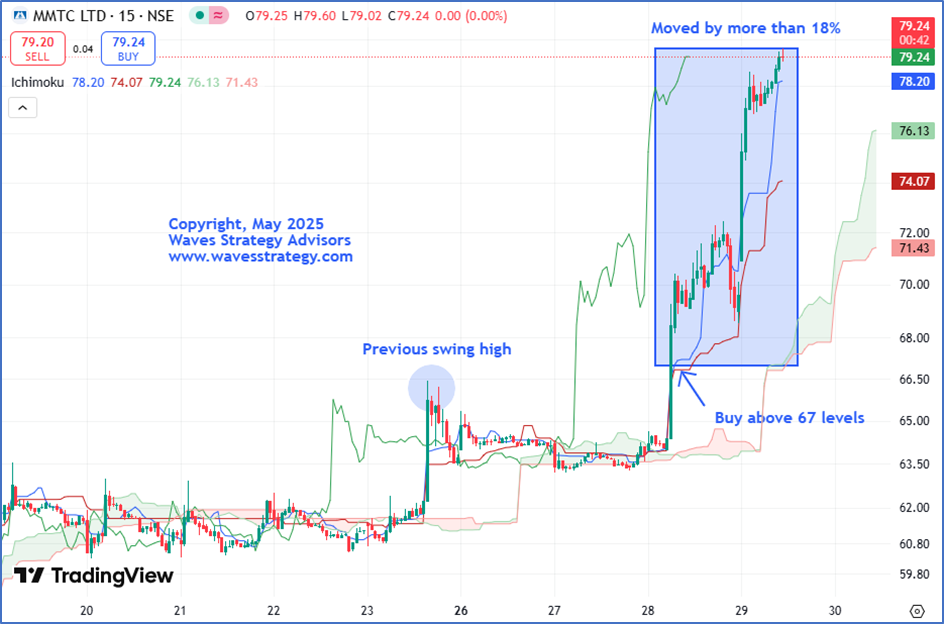
As expected, the stock after taking a dip towards the cloud found support of it and reversed on the upside. Once, prices breached above its previous swing high i.e. near 67 levels prices saw a massive gain of more than 18% in just a short span of 2 trading sessions despite major indices underperforming which is a sign of strength. Ichimoku cloud setup works like magic when combined with simple Price action, if caught at the right time it can lead to amazing results as seen above!

In a nutshell, one can ride the trend best when entered at the right time of the breakout. Traders can capture a trending move very efficiently by just using the above setup.

Trishul Membership - Transform the way you trade with the power of Neo Wave forecasting, In-depth training on Ichimoku Cloud, Elliott Wave, Master of Technical Analysis and the 5 Mantras of Options. KNOW MORE
Nifty Option Trading with the Help of Open Interest Analysis

 Nifty volume profile shows big players activity both from positional and intraday perspective.

Options Trading with Open Interest and Volume profile is one of the classic ways to trade.

Nifty Hourly chart with Open Interest analysis

Options Trading requires understanding of momentum, trend, time to expiry and range.

Open interest - showcases the total number of outstanding contracts for a specific asset at any given time. This analysis can be used for both Positional and Intraday basis and Open Interest is always viewed from the seller’s perspective as it helps to understand the big players activity.

As shown on above chart, the left side green buildup is suggesting change in Call open interest and right-side shows put open interest. Nifty for the past few sessions has been trading in a sideways fashion in a range of 24728 to 25050 levels with high volatility.  As we can observe, open interest has increased on the call side near 25k mark and recently the Index made multiple failed attempts to close above the 25k territory which makes it an important hurdle for the Index to cross. For now, a break above 25050 levels can lead to call sellers to panic post which up move can resume. Until then, we can expect prices to trade in the above-mentioned range.

In a nutshell, Option Trading can be made easier by using these simple methods of analysis, one can clearly form option strategy in direction of big players by looking at Open interest profile. It is also crucial to know strike price selection to make the most of the trending move.

Trishul Membership – Options Trading with Elliott wave, Neo wave, Ichimoku cloud, and sacred science of trading & forecasting is covered in the Trishul membership program scheduled on 7th - 8th June & 12th - 13th July, Fill out the form below for more details KNOW MORE

Nifty Path Derived Using Neo wave + Price action.

 When we combining Wave Theory along with price action does it help us in forming powerful setups?

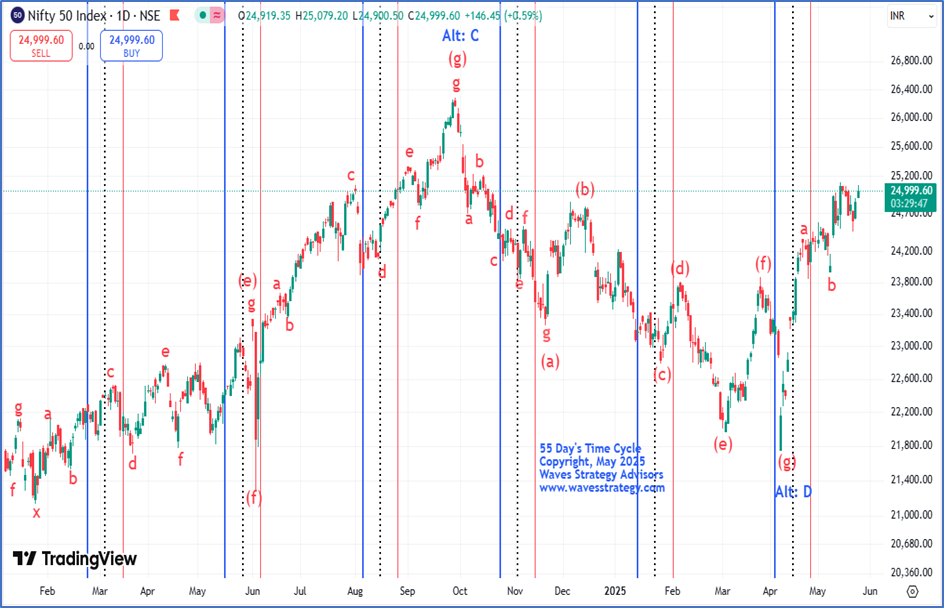
Neo wave is the GPS of the market that helps to understand the overall maturity of the trend. Neo wave is an advanced Elliott wave that provides forecasting ability.

Look how we derived a path for Nifty in our Agni Nifty research report and we managed to achieve our given targets consecutively for 4 trading sessions. Check out the article below-

Nifty Daily chart with Neo wave and Time cycle as on 26th May 2025.Anticipated Trading Strategy as on-

20th May 2025
(Spot) - Short positions can be created below 24900 with 24970 as stoploss and target of 24830 followed by 24760.

Trade set up for Futures – Futures positions can be initiated as per spot levels given above.

Trade set up for Options buying: Buy Nifty 22nd May 25150 PE if Nifty gives a 15-minutes close below 24950 (for target and stoploss refer above spot strategy).

21st May 2025
(Spot) -Long positions can be created if Nifty sustains above 24830 for an hour with 24750 as a stoploss and target of 24900 followed by 24970 levels.

Trade set up for Futures – Futures positions can be initiated as per spot levels given above.

Trade set up for Options buying: Buy Nifty 22nd May 24700 CE if Nifty sustains above 24830 for an hour (for target and stoploss refer above strategy).

22nd May 2025
(Spot) - Short positions can be created below 24650 with 24720 as stoploss and target of 24580 followed by 24500.

Trade set up for Futures – Futures positions can be initiated as per spot levels given above.

Trade set up for Options buying: Buy Nifty 22nd May 24800 PE buy above 170 with the stoploss of 110 and target 230 followed by 300 level. 

23rd May 2025
(Spot) - Long positions can be created above 24690 with 24620 as stoploss and target of 24760 followed by 24830 levels.

Trade set up for Futures – Futures positions can be initiated as per spot levels given above.

Trade set up for Options buying: Buy Nifty 29th May 24600 CE above 300 with stoploss of 240 and target of 360 followed by 420.

Amid wild swings and high volatility, our reports have consistently continued to shine and BANG ON!! Nifty moved in sync with our expectations and managed to achieve our given targets continuously for 4 trading sessions! We derived our path for Nifty with help of Wave theory, OI Data and price action.

AGNI (index) Research – Get access to daily research reports and advisory calls on Nifty, Bank Nifty, and Sensex along with charts, and options strategy, Know more.

Trishul Membership – Options Trading with Elliott wave, Neo wave, Ichimoku cloud, and sacred science of trading & forecasting is covered in the Trishul membership program scheduled on 7th - 8th June & 12th - 13th July, Fill out the form below for more detail KNOW MORE