Tuesday, October 31, 2023

Nifty Bank Nifty : Power of Elliott Wave and Time Cycles

Two important ingredients of predicting market are Time and Price action. It is possible to Time the market and trade in direction of trend.

Combining price action and Time both together is utmost important.

Nifty path anticipated and twitted on 30th Oct 2023Nifty has been moving as per the wave analysis. Above chart of Nifty shows the path that we derived much ahead on 30th Oct and tweeted as well. Nifty moved exactly in the same fashion as can be seen in the below chart.

Nifty path happened on 30th Oct 2023Bank Nifty also worked as per our prediction

Bank Nifty was also predicted on 21st Oct in the free webinar with 1000s of participants, which is visible in the below chart.

Bank Nifty Anticipated as on 21st Oct 2023The magic was experienced in the coming session as visible in the below chart. Bank Nifty corrected sharply as soon as 43600 was broken and found support on 26th Oct at 11:30 am which is Time cycle support for Bank Nifty and moved recovered from there.

Bank Nifty happened on 31st Oct 2023Elliott Wave Analysis, especially Neo wave can give exact direction and target. Strategies can be built keeping these levels in mind. Combining Time Analysis can give up exact time of entry even on the smaller time frame.

Two powerful techniques can compliment other technical analysis which will add conviction to the trade and make them profitable. There is a science behind and it works like magic.

3 Months Mentorship on Timing the Markets - Learn to time the market and trade with me for the period of 3 Months including Live trading, stock selection, Momentum, and Multibagger stock identification, Timing the entry to the very Day, Hour, and Minute using Time cycles and Elliott Wave analysis. Get access to MOC as soon as you register for Mentorship, Contact +919920422202 for more details. Fill the form below to know more

Monday, October 30, 2023

How to use Price Action with Indicators for analyzing stocks

 In the current market environment, there are stocks specific actions that can be witnessed. We can clearly see below the chart how bullish momentum can be captured.

Combination of trend indicator and price pattern is an amazing technique applied on a chart to understand why there was a rise and is this rise is sustainable.

We published RAMCOIND analysis in "The Financial Waves Short Term Update" on 26th October which our subscribers received pre-market every day. Check out below the detailed research report that we published.

RAMCOIND Daily chart Anticipated as on 26th October 2023

RAMCOIND 60 Mins chart Anticipated as of 26th October 2023

Wave analysis as of 26th October 2023

RAMCOIND has been moving higher recently and is intact in a strong uptrend. In the previous session, it closed with a massive gain of 5.35%.

On the daily chart, in the previous session prices formed a bullish candle. Price has closed above 198 which confirms the breakout of the rounding bottom pattern. We have shown the ADX indicator which indicates if the stock is trending or in a trading range. The low readings of ADX indicate that the stock is in a range. The Adx of this stock is 27.51 indicating a trending market. A reading above 25 means strong directional strength

As shown on the hourly chart, we have applied parabolic SAR which is used to determine the price direction as well as draw attention to when the price direction is changing. A series of dots placed below the price is deemed to be a bullish signal. The closest support is placed at 196.

In short, the trend for this stock is positive. Use dips towards 202-205 as a buying opportunity for a move towards 227-230 levels as long as 196 holds on the downside.

RAMCOIND Daily chart Happened as of 30th October 2023Happened: The stock moved as we expected. The price took support near the neckline and after a dip, a good rally was witnessed. Within just 3 trading sessions, the stock reached a high of 224.35 levels. Even though the market was down the stock has gained more than 11% and it has the potential to achieve our target of 227-230. In such a volatile market, the stock is holding well at higher levels.

3 Months Mentorship on Timing the Markets - Learn to time the market and trade with me for the period of 3 Months including Live trading, stock selection, Momentum, and Multibagger stock identification, Timing the entry to the very Day, Hour, and Minute using Time cycles and Elliott Wave analysis. Get access to MOC as soon as you register for Mentorship, Contact +919920422202 for more details. Fill the form below to know more

Thursday, October 26, 2023

Nifty Bang on using Time and FLD!

Nifty has witnessed a sharp fall since the previous week. It is amazing to see how the advanced tools like FLD gave an indication of this reversal very precisely.

FLD – Future Line of Demarcation is an important Technical analysis tool that helps us project price targets, support, and resistance points, and understand the underlying trend.

Following is the Nifty daily chart showing how the application of FLD helps determine crucial reversal areas and target points, which we derived with 1000s of participants in our weekly webinar on Friday i.e. on 20th October 2023.

Nifty Daily chart (Anticipated in our weekly webinar on Friday 20th October 2023 with 1000s of participants)

The Nifty Daily chart happened as of 26th October 2023The first chart shows the path for Nifty and targets on the downside which is picked up from our Friday (20th October 2023) webinar which we derived by using an indicator called FLD (Future Line of Demarcation). As per this our target 1 was 19230 which was clearly achieved in yesterday’s session (on 25th October 2023). Now prices are moving towards our final target of FLD which is near 19800 levels.

We were able to capture this fall of more than 600 points with the help of Time and FLD. Combine the above method with the Gann square of 9 to determine the important levels where Nifty might find support in the near term. It is amazing to see how these advanced methods get aligned together.

Master of Cycles (MOC) – is scheduled on 28th & 29th October 2023, where we will discuss clear trade setups using Hurst’s Time cycles, Gann square of 9, and derive trades on Options forming strategies. Limited seats, For more details visit here

3 Months Mentorship on Timing the Markets - Learn to time the market and trade with me for the period of 3 Months including Live trading, stock selection, Momentum, and Multibagger stock identification, Timing the entry to the very Day, Hour, and Minute using Time cycles and Elliott Wave analysis. Get access to MOC as soon as you register for Mentorship, Contact +919920422202 for more details. Fill out the form below to learn more

Monday, October 23, 2023

HDFC Bank 53 Day’s Time Cycle working like magic!

Time Cycle helps to understand if the overall trend is going to reverse back on upside. This is advanced technical analysis method for timing the market.

HDFC Bank is following 53 Day’s Time cycle very well and we can clearly see that prices are forming low every time it approaches near to this cycle. See detail research below how one can predict this early move with the help of Time cycle!

Below is the chart of HDFC Bank along with 53 Days Trading Time cycle.

HDFC Bank 53 Period Time Cycles on the Daily chart

Time Cycle analysis: The best way to enter the trend is on the basis of Time cycles. Cycles are essentially used to capture lows. In the above chart as well, we can see most of the lows are formed on our cycle and after almost every 53 period, HDFC Bank has shown a positive reversal. If prices confirm along with Time it can give best conviction for traders.

In the month of September also we can see prices made a low near our cycle and showed a good rise from 1560 to 1670 levels. In mid of September low of cycle was taken out. This suggests that top is made and high of 1670 will not be taken out until 9th November. Since our next cycle is due on 9th November so we expect prices to remain sideways or under some pressure.

Time Cycle gives much earlier signals and it is working like magic. Time Cycles are powerful studies that can give reversal areas.

Master of Cycles (MOC) – is scheduled on 28th & 29th October 2023, where we will discuss clear trade setups using Hurst’s Time cycles, Gann square of 9 and derive trades on Options forming strategies. Limited seats, For more details visit here

3 Months Mentorship on Timing the Markets - Learn to time the market and trade with me for the period of 3 Months including Live trading, stock selection, Momentum, and Multibagger stock identification, Timing the entry to the very Day, Hour, and Minute using Time cycles and Elliott Wave analysis. Get access to MOC as soon as you register for Mentorship, Contact +919920422202 for more details. Fill the form below to know more

Thursday, October 19, 2023

Intraday Trading Using Time Cycle on 15 and 5 minutes chart

Time Cycles is a powerful Technical analysis study that can give a very clear reversal areas to traders.

Ever happened that it is difficult to make money even after knowing the trend because the timing was off by just an hour? Here is the solution to the problem. Time the trade precisely to the very minute.

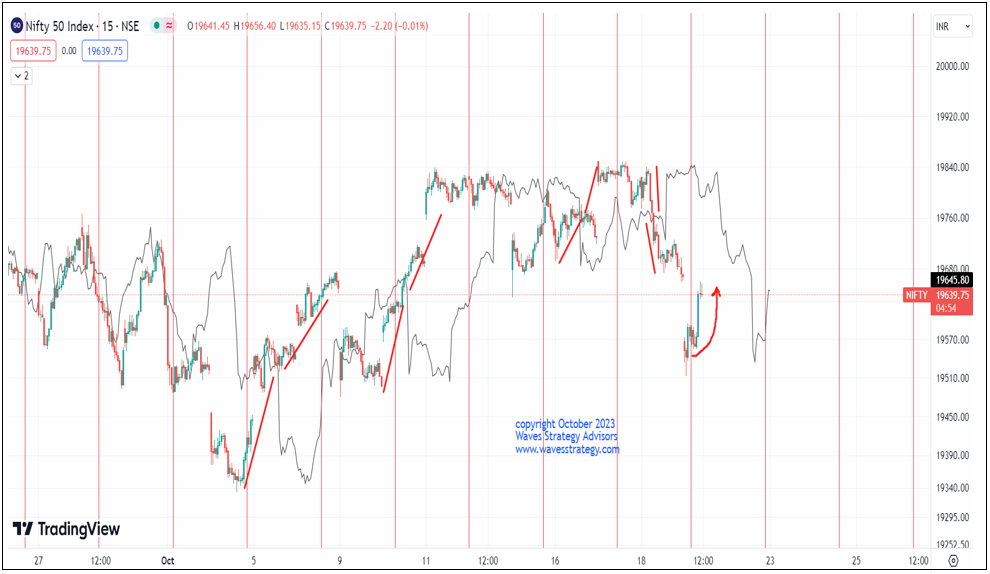
Now look at the below charts of Nifty on a 15 minutes and 5 minutes time frame. Also keep in mind both the charts shows a synchronized time behavior.

Nifty 15 minutes Chart (43 period Time cycle)

Time is of the essence for trading successfully. By using Time cycles traders can even derive targets for price using the concept of Future Line of Demarcation (FLD)

Future Line of Demarcation (FLD)   is an important Technical analysis tool that helps us project price targets, support and resistance points, and understand the underlying trend.

Whenever prices have crossed above the black line we get the target on the upside with prices moving an equal amount up from the intersection point.

The nifty 15 minutes chart shows the target being achieved on most occasions whenever prices intersected the FLD lines.

Nifty 5 minutes Time cycle – For intraday Traders especially Options one can catch reversals even in 5 minutes time frame. The vertical lines are time cycle reversal zones and we can see that even the latest move on the upside after the spike down has been on this 5 minutes Time cycle.

Use simple price action methods along with Time cycle to derive not only time reversal areas but also targets.

Combine the above method with the Gann square of 9 to find out the important levels where Nifty might find support in the near term. It is amazing to see how these advanced methods get aligned together.

Master of Cycles (MOC) – is scheduled on 28th & 29th October 2023, where we will discuss clear trade setups using Hurst’s Time cycles, Gann square of 9, and derive trades on Options forming strategies. Limited seats, For more details visit here

3 Months Mentorship on Timing the Markets - Learn to time the market and trade with me for the period of 3 Months including Live trading, stock selection, Momentum, and Multibagger stock identification, Timing the entry to the very Day, Hour, and Minute using Time cycles and Elliott Wave analysis. Get access to MOC as soon as you register for Mentorship, Contact +919920422202 for more details. Here is the path to becoming a successful trader 

“Timing the Markets using Cycles and CandleSticks Excellent WAVES of- mind management explained, patience, science, time cycle & predictability, destiny of market, momentum methods, mentorship, risk management” – By Pankaj N Tardeja

“Amazed by the time cycles and how they exactly coincide with the important political and financial events. Awestruck when I realized that we can even predict when would be the next event that will drive major changes in the stock market. More importantly, you have made it so simple to understand this complicated topic. Thank you!” – By Sreedhar Yeleswarapu