Thursday, June 12, 2025

Bajaj Finance Bang on with the Help of Advanced Tools!

 Elliott wave when combined with price action leads to interesting results. By using Time cycle and wave theory together it can help predict capture reversals way before it has happened.

New traders want to trade and capture every moves & on other hand seasoned ones know the real money lies in sitting tight and try to capture the best of the 3rd wave.

See the detailed analysis on Bajaj Finance Ltd that we published in our Aakash monthly report on 26th May 2025.

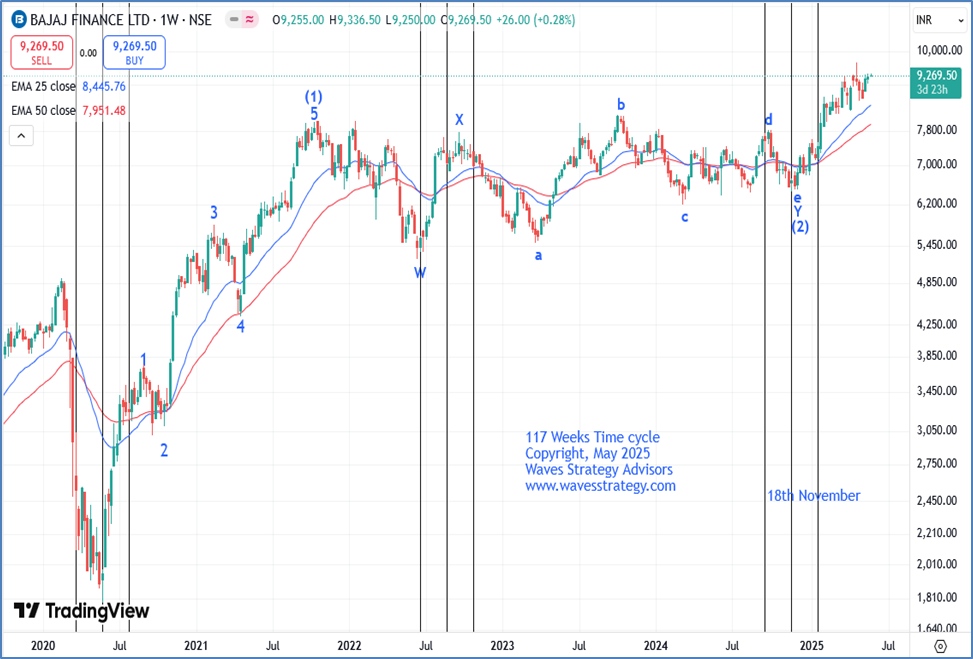
Bajaj Finance Ltd Weekly chart: Anticipated as on 26th May 2025.
Bajaj Finance Ltd Daily chart with Gann levels: Anticipated as on 26th May 2025
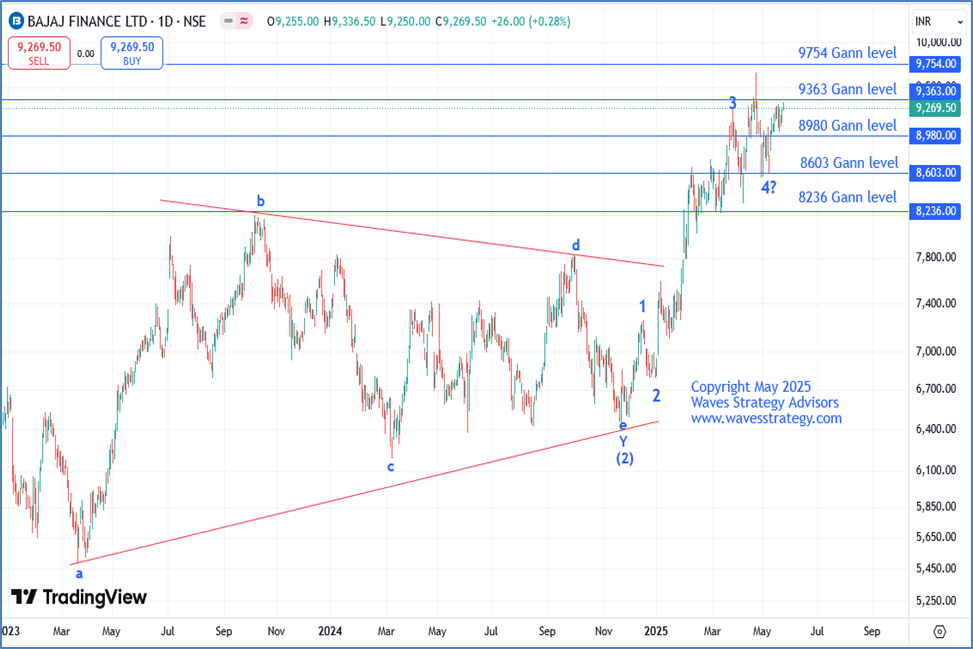
Anticipated wave Analysis as on 26th May 2025

We witnessed a sharp rise in Nifty since the start of April, and it managed to cross the 25k mark in May. In this rally, the financial services sector acted as a fuel. Wherein, Bajaj Finance continued to outperform its sector and its peer companies.

If the RBI announces a rate cut in the forthcoming season, the Auto, Banking, and Finance sectors are likely to be amongst the primary beneficiaries. This hints that the Bajaj Finance has the potential to show a good rise in the coming weeks. Now, let’s understand the detailed analysis from a technical perspective.

Weekly Chart – As per the 3-candlestick rule, the weekly bias has shifted in favour of the bulls. In terms of indicators, we have shown the Exponential Moving Average. We have identified that recently 25- week EMA (Exponential Moving Average) and 50-week EMA have witnessed a bullish crossover, which was in sync with time, and since then prices have resumed its bull run.

117 Weeks’ Time cycle – Time cycle is an advanced tool that can be utilized to identify early reversals and catch the bottom. We have plotted 117- weeks’ Time cycle and it has worked out wonderfully. It has been efficient in capturing almost all the major lows, post which we have seen a reversal on the upside. As of now, the stock has already entered its cycle zone, which was due on 18th November 2024 and from the low’s prices have shown a rally of more than 44%.

Neo wave Analysis – As we can observe that the stock has been moving precisely as per our counts. In which, the Primary wave (1) got completed on the upside in October 2021. Since then, the entire correction was in the form of Primary wave (2), which got completed on the downside in the form of a complex correction pattern (w-x-y). As the current rise have retraced its prior leg in faster time, it suggests that Primary wave (3) has started to unfold on the upside. Now, we are only in wave 1 of (3).

Gann Square of Nine – We extend our study to the Gann square of nine to get further conviction on levels even when prices are in uncharted territory. Wherein, the Gann level of 9363 levels is acting like an immediate hurdle as prices have failed to close above it previously and reversed on the downside from it. Now, a decisive break above 9363 levels can lead to a trending move towards the next Gann level of 9754 levels.

In a nutshell, Bajaj Finance has continued to glitter. The primary trend, according to the Dow theory, remains on the positive side. For now, a decisive break above 9363 levels can resume the rally on a daily basis with the primary target of 9754(Gann level), followed by ???? levels. On the downside, ???? levels is the major support area.

Bajaj Finance Daily Chart: Happened as on 12th June 2025Happened as on 12th June 2025
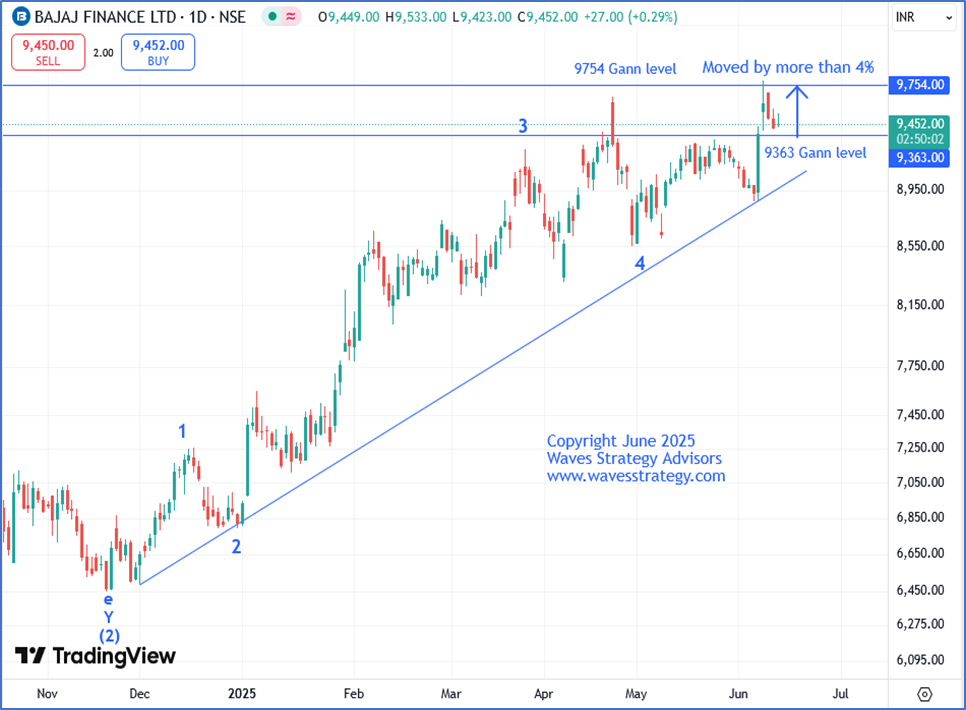
In our monthly report, we expected Bajaj Finance to show an impulse rise as prices were in Primary wave 3 which is considered as the most trending wave as per the guidelines. Post RBI unexpected interest rate cut by 50 basis points and CRR cut by 100 basis points; Financial services sector was one of the major gainers. Wherein, Bajaj Finance moved in sync with our expectations and BANG ON!!

Prices broke 9363 levels and managed to surge by more than 4% in just one day and achieved our target 1 of 9754 which is a Gann level and made a lifetime high of 9788 levels. We were able to predict this rise before it actually happened using Time cycle, wave theory and Gann square of 9.

Trishul Membership - Transform the way you trade with the power of Neo Wave forecasting, In-depth training on Ichimoku Cloud, Elliott Wave, Master of Technical Analysis and the 5 Mantras of Options. Know more here

Tuesday, June 10, 2025

Is Bank Nifty resuming its Bull Run?

 Elliott wave is the GPS of the market that helps to understand the overall maturity of the trend. Elliott wave is a method that is used to identify price pattern and predict market movements. Bank Nifty has been moving precisely as per our Elliott-wave counts.

Novices think of getting at exact lows and getting out at exact highs but expert traders try to capture the best of the 3rd wave and wait like an eagle for that exact moment to catch the prey most of the time.

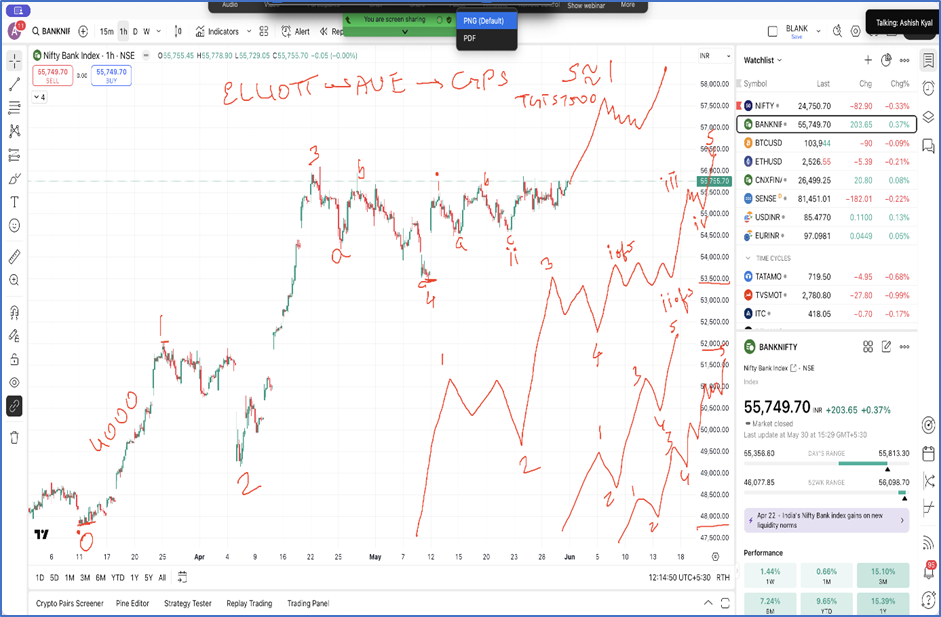
Below is the chart which shows a detailed path of Bank Nifty which we discussed in our past weekly webinar held on 31st May 2025 with 1000’s of participants.

Bank Nifty Hourly chart: Anticipated as on 31st May 2025
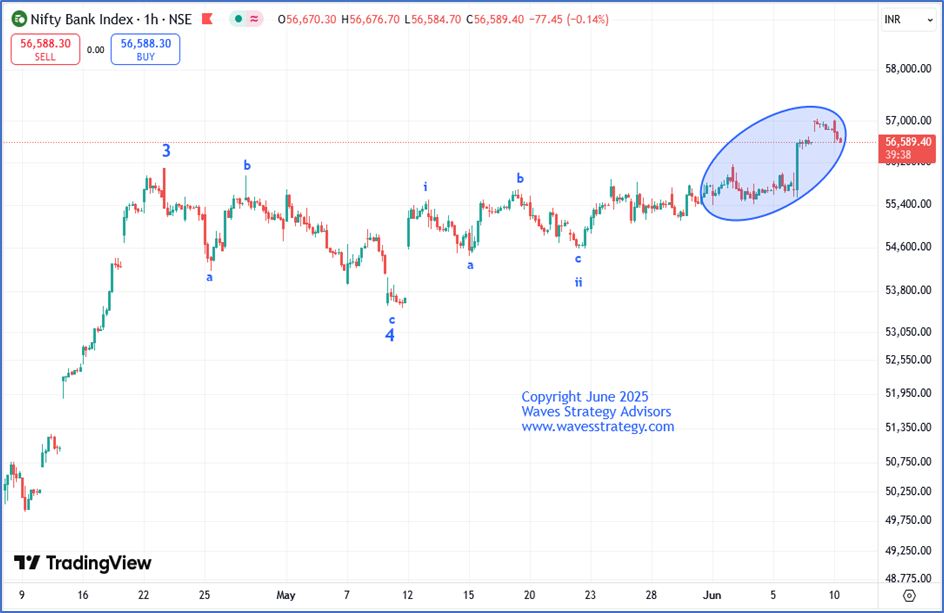
Bank Nifty Hourly Chart: Happened as on 10th June 2025.
Anticipated – Wave 4 recently got completed on the downside in the form of a flat pattern. Post which Wave 3 started to unfold on the upside. We anticipated that internal wave iii of wave 3 has started to unfold on the upside. As wave 3 can go up to 161.8% of wave 1, which derives the target of 57500 levels on the upside.

Happened – Bank Nifty is in sync with our Elliott wave counts. As one can observe, The Index was trading at 55755 levels when we anticipated an up move in the Index and BANG ON!! Prices moved as expected and prices made a high above 57000 levels in today’s session which is nearly a move of 1300 points. As of now, we are in wave (iii) of wave (3) which is considered the most trending wave according to the guidelines. For now, Index is on the journey to achieve our given target of 57500 levels.

In a nutshell, Bank Nifty is unfolding in the form of wave 3 on the upside. A breach below 55500 can rule out this wave pattern, until then we can expect trending move to continue in the Index.

Trishul Membership - Transform the way you trade with the power of Neo Wave forecasting, In-depth training on Ichimoku Cloud, Elliott Wave, Master of Technical Analysis and the 5 Mantras of Options, Know more here

Monday, June 9, 2025

How to trade options by analysing big player activity?

Options trading requires an understanding of momentum. The best indicator to measure this is using Keltner Channel along with KST indicator.

Which are the Powerful Indicators to use for Options buying?

Below chart shows application of 4 powerful indicators – Keltner Channel, Volume Profile, Open Interest and KST momentum indicator. When combined together it can lead to interesting results.

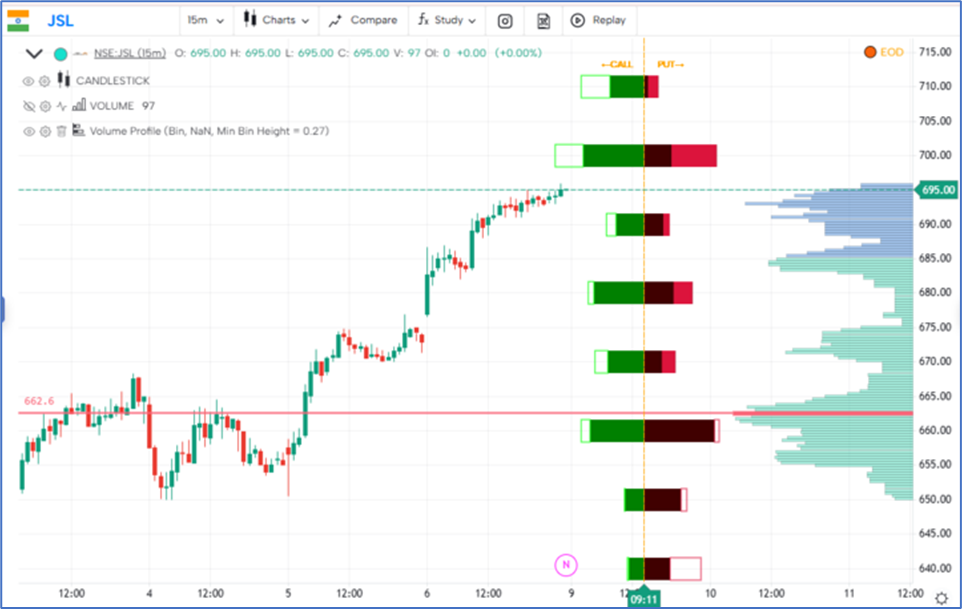
Jindal Stainless Ltd. 15 Mins Chart:
Jindal Stainless 660 Call Option 15 mins chart:Volume profile – Volume Profile is a powerful tool that highlights price levels where major volume is accumulated. One of the key components of this indicator is the Point of Control (POC) – the price level with the highest traded volume. Volume profile helps to derive price action area which helps to find critical support and resistance zones, allowing for more precise entries and exits
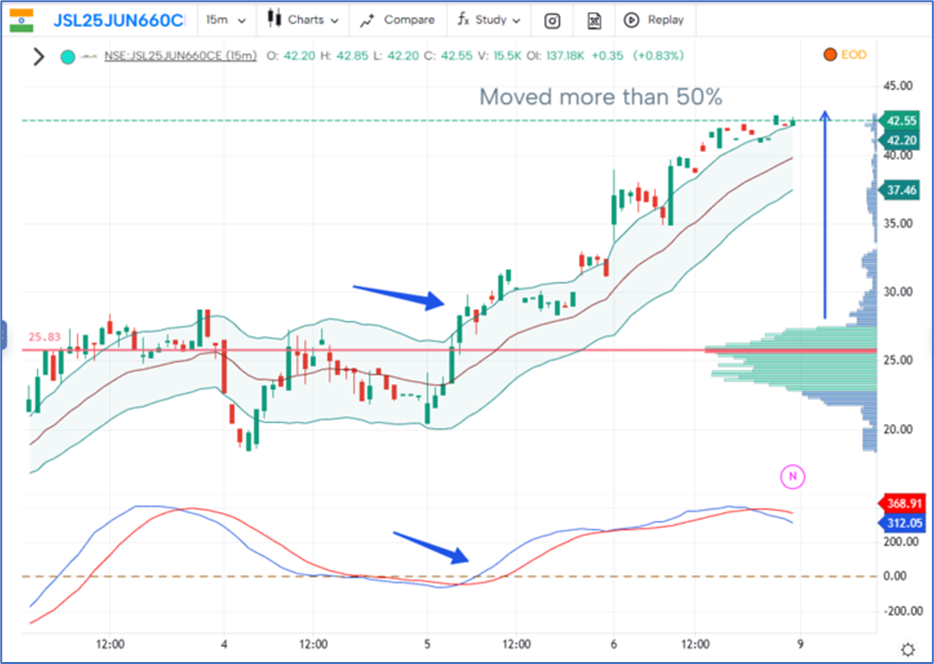
Open Interest – showcases the total number of outstanding contracts for a specific asset at any given time. Also, OI is best interpreted from the perspective of option sellers, often considered the “smart money” or institutional players. As we can see prices broke above its POC area i.e., 662 levels which near its important hurdle as per the OI data, giving a classic buy signal and one can utilise it by buying call option or futures.

Call Option - We can observe that 25 levels has the highest cumulative volume in this strike. On 05th June 2025, prices broke above POC area i.e., 25 levels which we combined with Keltner channel breakout for getting the perfect entry. Also, just a breakout is not sufficient as it has to be looked in conjunction with KST Momentum indicator crossing the zero line. So, on 5th June 2025 prices broke above the Keltner channel with KST confirmation and showed a rally of more than 50% in a short period of time.

In a nutshell, option trading can be made easier by using these simple methods of analysis. One can clearly do option buying by analysing Open interest profile & Volume profile and combined them with KST and Keltner Channel indicators.

Trishul Membership - Transform the way you trade with the power of Neo Wave forecasting, In-depth training on Ichimoku Cloud, Elliott Wave, Master of Technical Analysis and the 5 Mantras of Options. KNOW MORE

Thursday, June 5, 2025

Is it possible to Time Bank Nifty using 89 period Time Cycle?

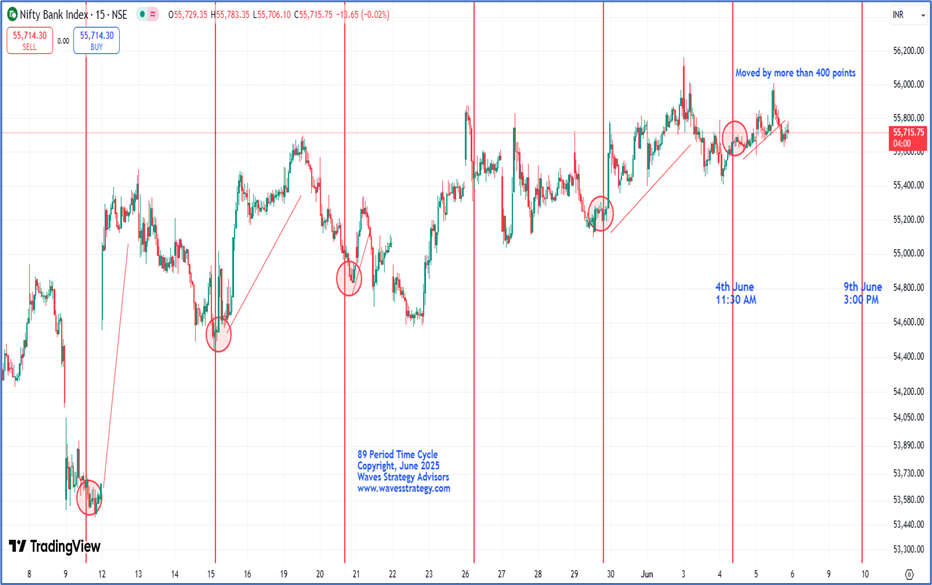
 It is fascinating to see how accurately Time cycles can predict early reversals on the Bank Nifty Index, in the same way as stocks.

Time Cycle is a Technical Analysis study and surprising such concepts can help to Time the market and help to catch early reversals which improves decision making of the traders. When we combine Time trading with price action it leads to interesting results!

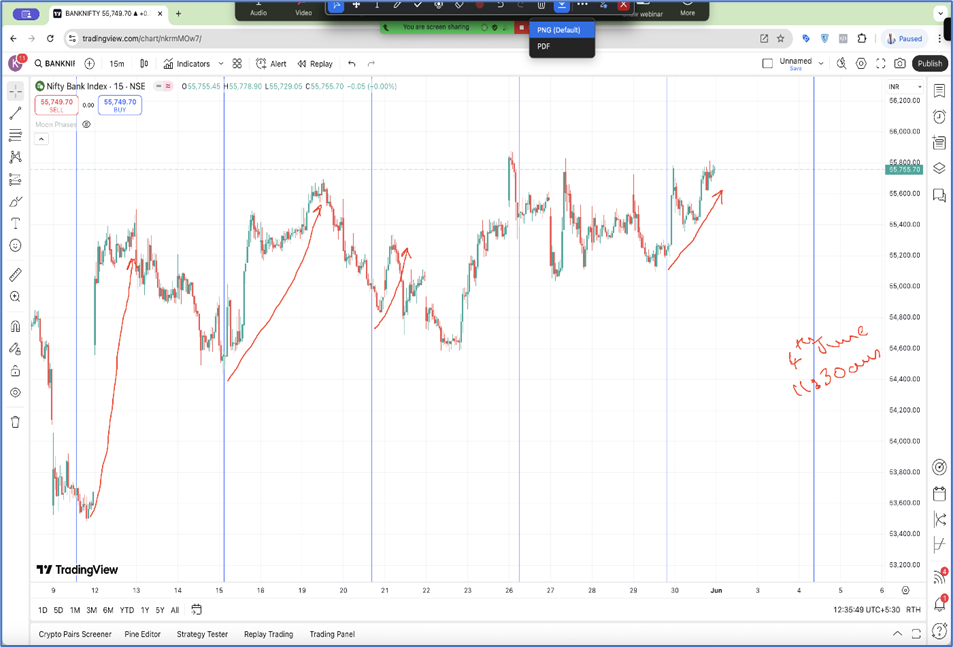
Below is the chart which shows a detailed path of Bank Nifty which we discussed in a in our past weekly webinar held on 31st May 2025 with 1000’s of participants.

Bank Nifty 15 min chart: Anticipated as on 31st May 2025.

Bank Nifty 15 min chart: Happened as on 05th June 2025.Time cycle works well to catch early reversals even on shorter time frames like 15 mins, 5 mins. For Bank Nifty, 89 period of Time cycle works extremely well on the 15-min Time frame. Time trading has to be combined with price action for precise entry. On the above chart, we can see that majority of the time when prices are near the cycle zone, we have seen a pullback on the upside.

As anticipated on our weekly webinar held on 31st May 2025 that the Index can form a short-term low near our cycle zone which was due on 04th June 2025 at 11:30 AM and post which pullback can be seen on the upside. Bang on! Index moved precisely as expected and made low near 55580 levels on 04th June 2025 and thereafter prices witnessed a sharp pullback of more than 400 points on the upside which was majorly fuelled by the rally in Private sector banks. This is the power of Time trading!

In a nutshell, by combining this science of Time trading one need not worry about missing out the trend and if Time is in favour, then one can predict moves well in advance.

The next cycle is due by 09th June 3:00 PM, near the same one can look for buying opportunity.

Trishul Membership – Options Mantra (OM) is starting on 7th – 8th June 2025 followed by Elliott wave and Sutra of Waves (SOW). Ensure to be a part of this Trishul Membership to get bonus videos, Only a few seats remaining. Fill below form for more details. KNOW MORE

Bajaj Finance - Sharply Down But Time to BUY? Volume Profile, KST Method

 Bajaj Finance is moving down over past few days. Prices are nearing crucial support levels on downside, But is it time to buy?

Volume profile helps to derive price action area which helps to identify accurate entry and exit. Along with this, Keltner Channel and KST combined is a powerful setup, one can use it directly to trade options.

This setup helps traders to catch the momentum early so that one can stay ahead of the majority crowd. This setup can be used in stocks as well which can be seen below: -

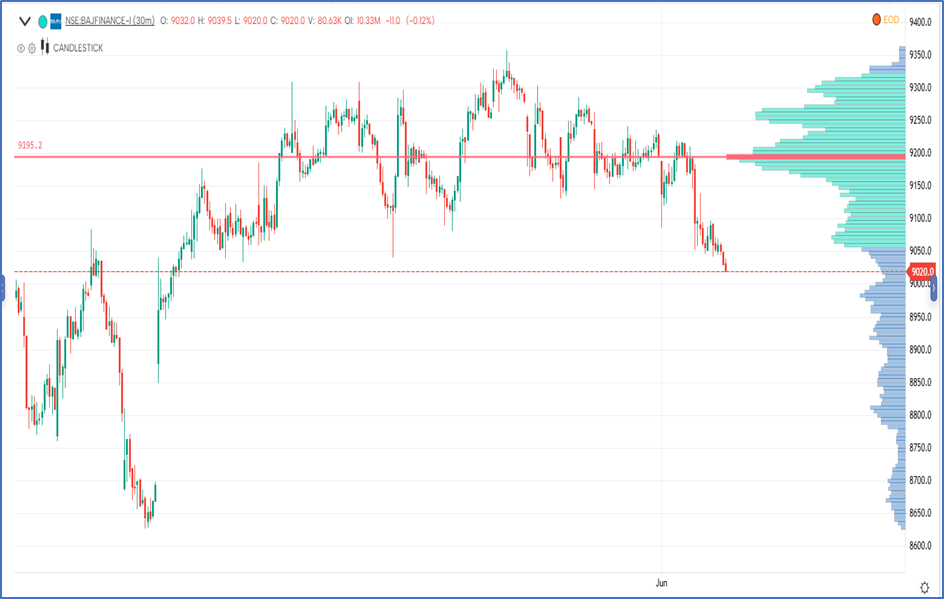
Bajaj Finance 30 Minutes Chart with Volume Profile:
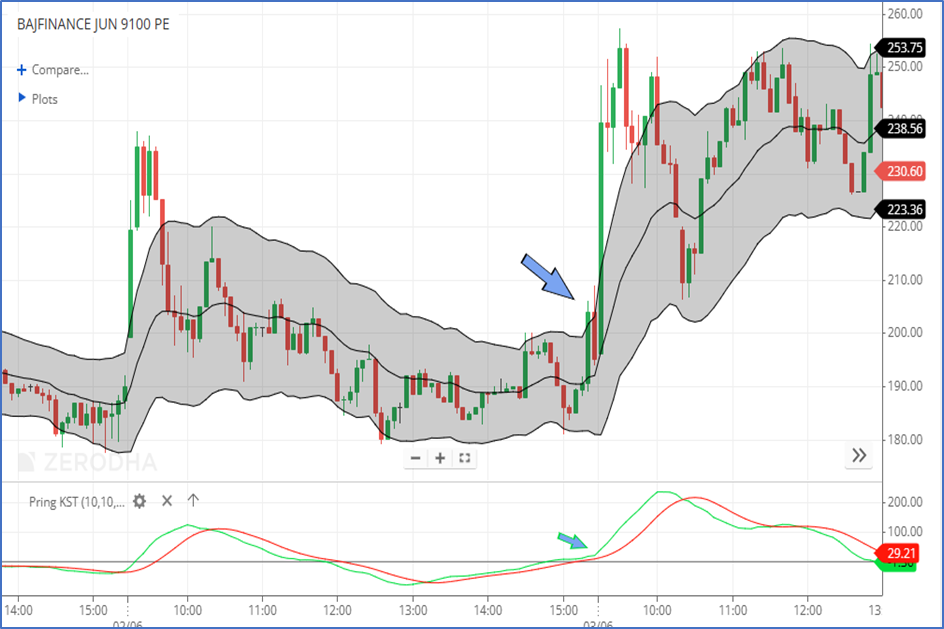
Bajaj Finance 9100 Put Options 5 min chart:
Volume profile
 shows big player activity.  In Bajaj Finance Volume point of control area is near 9200(fut) levels. This is the area where highest cumulative volume has taken place. This acts as a resistance or support. Prices recently gave a breakdown from it and we saw a sharp selloff as the Volume point of control was broken down. This also indicated that on intraday or short term basis one can look forward to buy puts or short futures. Let us look at how to combine options to derive trade along with this information.

Options Trading Strategy -We have shown Keltner Channel and KST momentum indicator on the Bajaj Finance 9100 PE strike.

Keltner channel shows if there is a significant movement and breakout in one direction. This has to be accompanied by KST moving above the 0 line as well. Also, just a breakout on Keltner Channel is not sufficient as it has to be looked in conjunction with momentum indicator. So on, 3rd June 2025, the confirmation candle took out the high of the breakout candle which gave a buy signal on Put Options according to the setup. We have seen put option rising from 210 levels to 257 levels in just matter of few minutes.

The above strategy is used for Intraday trading but can be applied for positional trade setup as well by changing time frames. Understanding exact application of Keltner Channel with KST is utmost important.

Trishul Membership – Options Mantra (OM) is starting on 7th – 8th June 2025 followed by Elliott wave and Sutra of Waves (SOW). Ensure to be a part of this Trishul Membership to get bonus videos, Only a few seats remaining. Fill below form for more details: KNOW MORE